 PLZ HELP!! will give 5 starss!
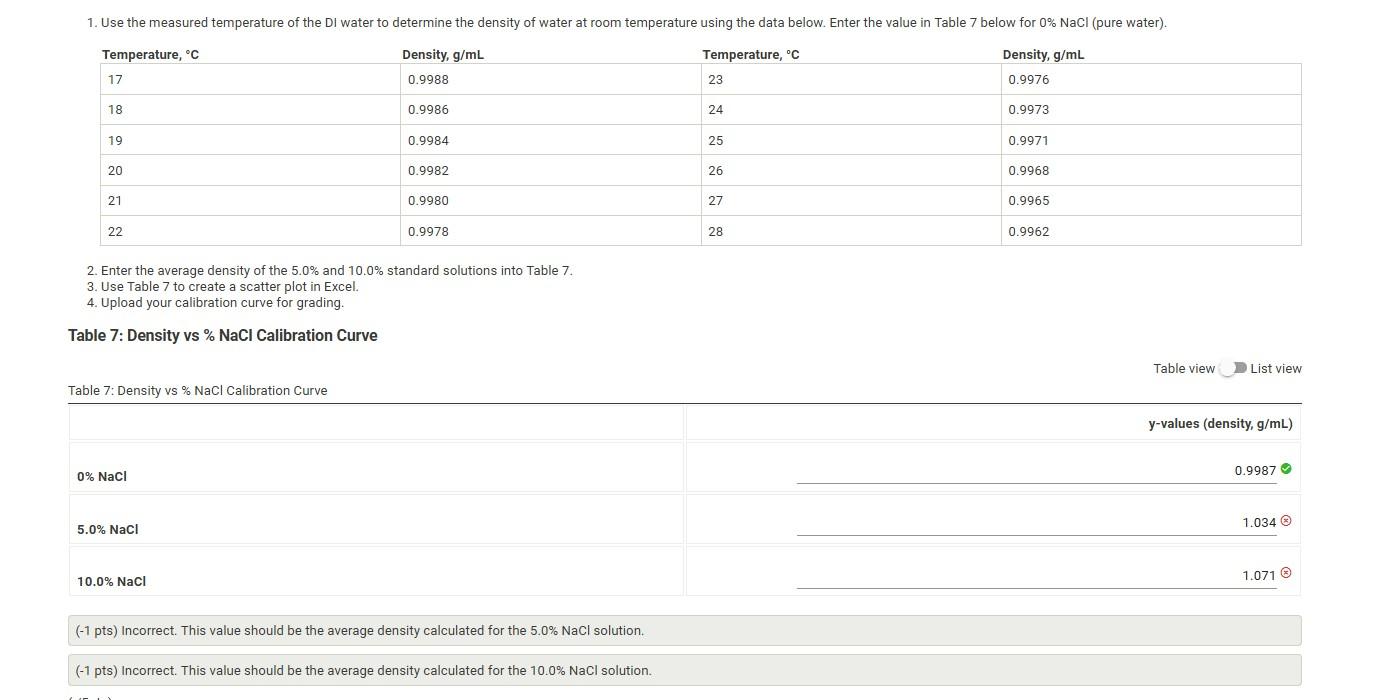
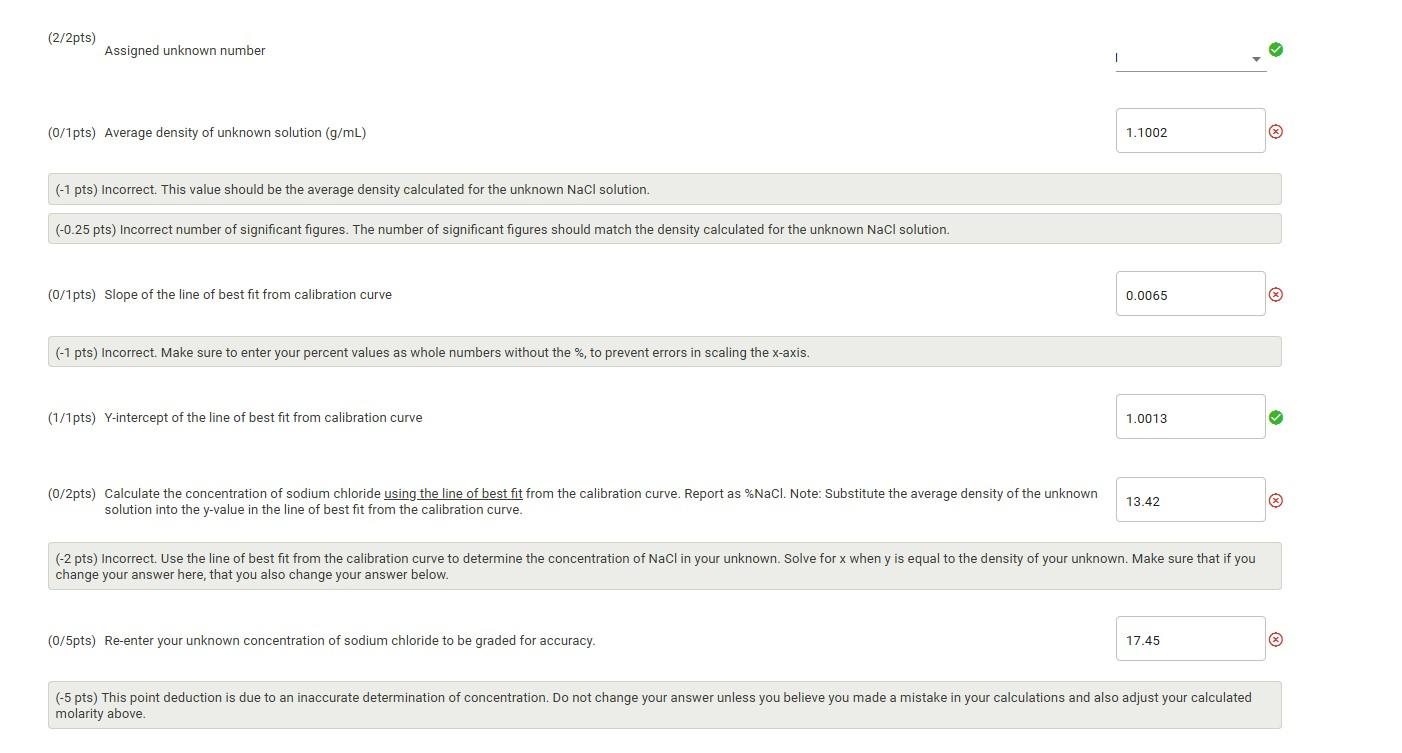
2. Enter the average density of the 5.0% and 10.0% standard solutions into Table 7 . 3. Use Table 7 to create a scatter plot in Excel. 4. Upload your calibration curve for grading. Table 7: Density vs \% NaCl Calibration Curve Table view List view (2/2pts) Assigned unknown number (0/1pts) Average density of unknown solution (g/mL) ( ( 1 pts) Incorrect. This value should be the average density calculated for the unknown NaCl solution. (0.25 pts) Incorrect number of significant figures. The number of significant figures should match the density calculated for the unknown NaCl solution. (0/1pts) Slope of the line of best fit from calibration curve ( ( 1 pts) Incorrect. Make sure to enter your percent values as whole numbers without the %, to prevent errors in scaling the x-axis. (1/1pts) Y-intercept of the line of best fit from calibration curve (0/2pts) Calculate the concentration of sodium chloride using the line of best fit from the calibration curve. Report as \%NaCl. Note: Substitute the average density of the unknown solution into the y-value in the line of best fit from the calibration curve. (x) change your answer here, that you also change your answer below. (0/5pts) Re-enter your unknown concentration of sodium chloride to be graded for accuracy. molarity above. 2. Enter the average density of the 5.0% and 10.0% standard solutions into Table 7 . 3. Use Table 7 to create a scatter plot in Excel. 4. Upload your calibration curve for grading. Table 7: Density vs \% NaCl Calibration Curve Table view List view (2/2pts) Assigned unknown number (0/1pts) Average density of unknown solution (g/mL) ( ( 1 pts) Incorrect. This value should be the average density calculated for the unknown NaCl solution. (0.25 pts) Incorrect number of significant figures. The number of significant figures should match the density calculated for the unknown NaCl solution. (0/1pts) Slope of the line of best fit from calibration curve ( ( 1 pts) Incorrect. Make sure to enter your percent values as whole numbers without the %, to prevent errors in scaling the x-axis. (1/1pts) Y-intercept of the line of best fit from calibration curve (0/2pts) Calculate the concentration of sodium chloride using the line of best fit from the calibration curve. Report as \%NaCl. Note: Substitute the average density of the unknown solution into the y-value in the line of best fit from the calibration curve. (x) change your answer here, that you also change your answer below. (0/5pts) Re-enter your unknown concentration of sodium chloride to be graded for accuracy. molarity above

 PLZ HELP!! will give 5 starss!


