Answered step by step
Verified Expert Solution
Question
1 Approved Answer
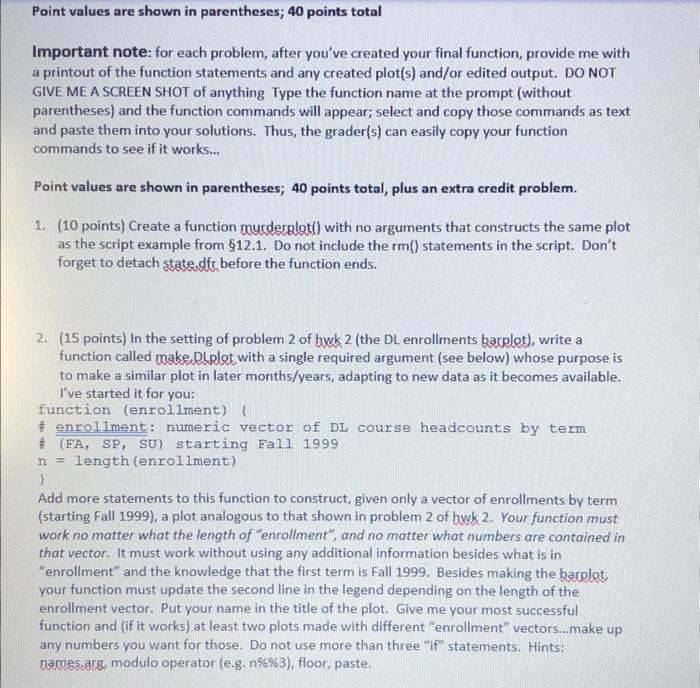
Point values are shown in parentheses; 40 points total Important note: for each problem, after you've created your final function, provide me with a


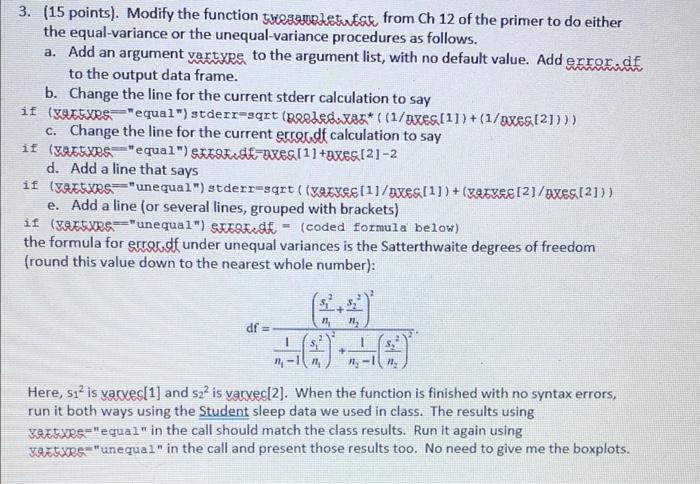
Point values are shown in parentheses; 40 points total Important note: for each problem, after you've created your final function, provide me with a printout of the function statements and any created plot(s) and/or edited output. DO NOT GIVE ME A SCREEN SHOT of anything Type the function name at the prompt (without parentheses) and the function commands will appear; select and copy those commands as text and paste them into your solutions. Thus, the grader(s) can easily copy your function commands to see if it works... Point values are shown in parentheses; 40 points total, plus an extra credit problem. 1. (10 points) Create a function murderplat() with no arguments that constructs the same plot as the script example from 12.1. Do not include the rm() statements in the script. Don't forget to detach state.dfr before the function ends. 2. (15 points) In the setting of problem 2 of bwk 2 (the DL enrollments barplot), write a function called make Diplot with a single required argument (see below) whose purpose is to make a similar plot in later months/years, adapting to new data as it becomes available. I've started it for you: function (enrollment) { # enrollment: numeric vector of DL course headcounts by term # (FA, SP, SU) starting Fall 1999 n = length (enrollment) } Add more statements to this function to construct, given only a vector of enrollments by term (starting Fall 1999), a plot analogous to that shown in problem 2 of bwk 2. Your function must work no matter what the length of "enrollment", and no matter what numbers are contained in that vector. It must work without using any additional information besides what is in "enrollment" and the knowledge that the first term is Fall 1999. Besides making the barplot, your function must update the second line in the legend depending on the length of the enrollment vector. Put your name in the title of the plot. Give me your most successful function and (if it works) at least two plots made with different "enrollment" vectors...make up any numbers you want for those. Do not use more than three "if" statements. Hints: names.arg, modulo operator (e.g. n%%3), floor, paste. 3. (15 points). Modify the function wesemplet Est from Ch 12 of the primer to do either the equal-variance or the unequal-variance procedures as follows. a. Add an argument vartype to the argument list, with no default value. Add error.df to the output data frame. b. Change the line for the current stderr calculation to say if (xALEXES "equal") stderr-sqrt (poeded.x8* ((1/axes[1])+(1/axes[2]))) c. Change the line for the current errordf calculation to say if (XAESXRS "equal") SFERE d axes[1]+axes[21-2 d. Add a line that says = if (XAEXRS "unequal") stderr-sqrt ((xatxee[1]/axes[1])+(xatxe [2]/axes[2])) e. Add a line (or several lines, grouped with brackets) (XAEXES"unequal") SEERE SE (coded formula below) if the formula for error.df under unequal variances is the Satterthwaite degrees of freedom (round this value down to the nearest whole number): " n1, 2020 + df = Here, $1 is varxes[1] and s22 is varves[2]. When the function is finished with no syntax errors, run it both ways using the Student sleep data we used in class. The results using Xarxes="equal" in the call should match the class results. Run it again using KAESXES "unequal" in the call and present those results too. No need to give me the boxplots.
Step by Step Solution
★★★★★
3.54 Rating (154 Votes )
There are 3 Steps involved in it
Step: 1
1 Heres the function ...
Get Instant Access to Expert-Tailored Solutions
See step-by-step solutions with expert insights and AI powered tools for academic success
Step: 2

Step: 3

Ace Your Homework with AI
Get the answers you need in no time with our AI-driven, step-by-step assistance
Get Started


