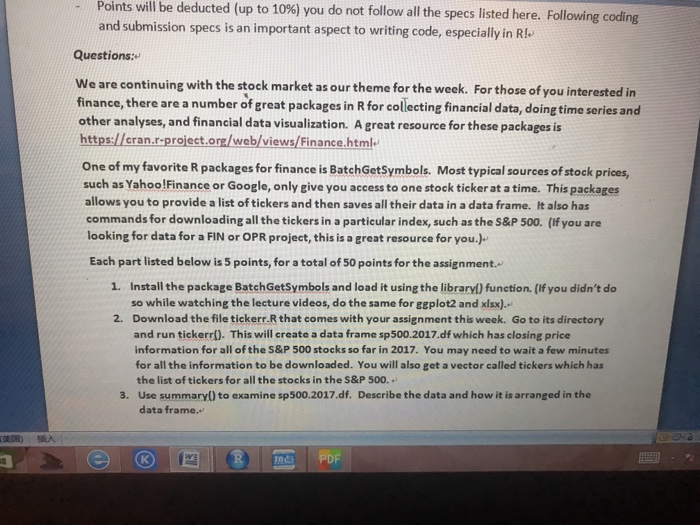
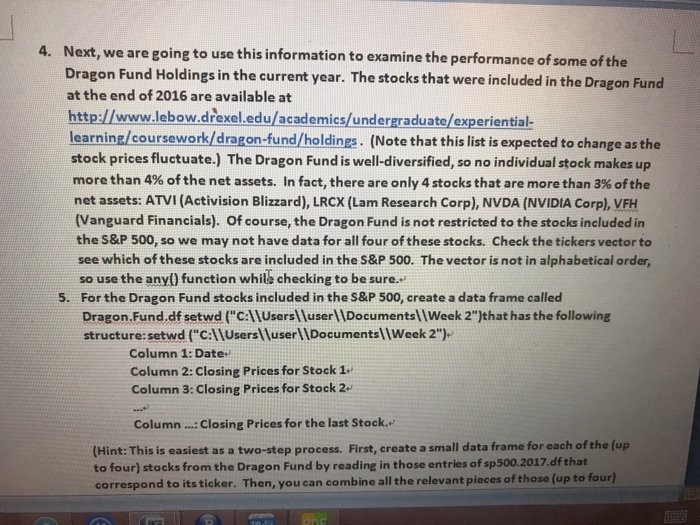
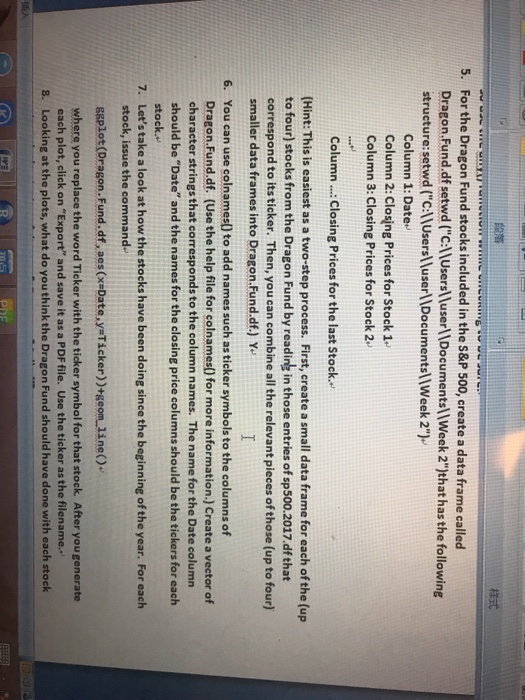
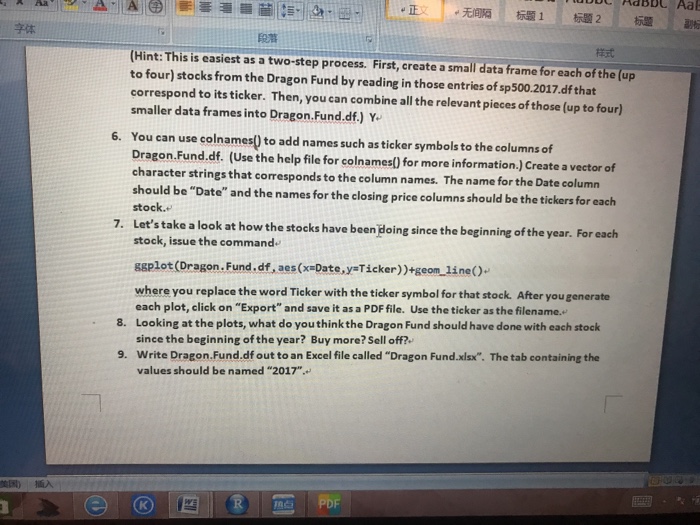
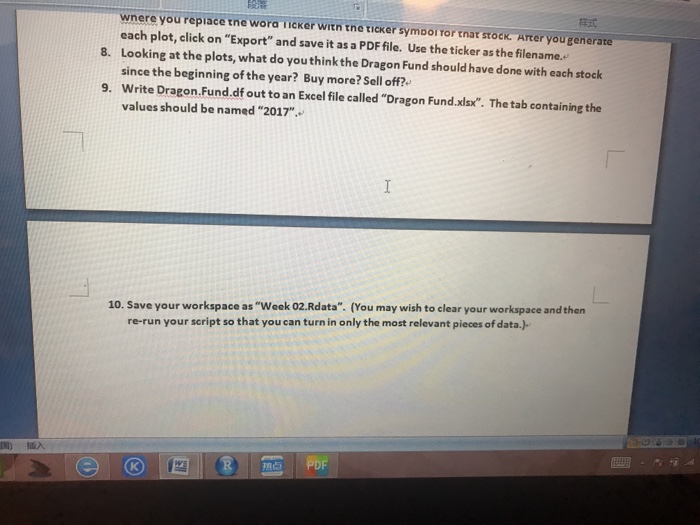
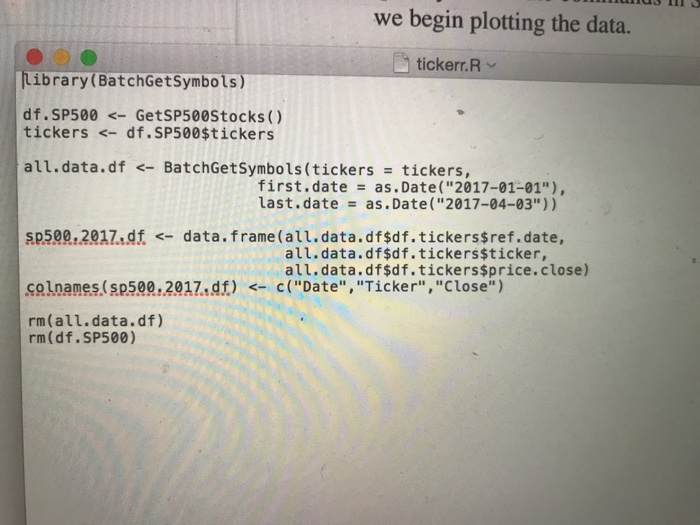
Points will be deducted (up to 10%) you do not follow all the specs listed here. Following coding and submission specs is an important aspect to writing code, especially in Rl Questions: We are continuing with the stock market as our theme for the week. For those of you interested in finance, there are a number of ereat packages in R for collecting financial data, doing time series and other analyses, and financial data visualization. A great resource for these packages is https://eran.r-project.ora/web/views/Finance.html One of my favorite R packages for finance is BatchGetSymbols. Most typical sources of stock prices, such as YahoolFinance or Google, only give you access to one stock ticker at a time. This packages allows you to provide a list of tickers and then saves all their data in a data frame. It also has commands for downloading all the tickers in a particular index, such as the S&P 500. (If you are looking for data for a FIN or OPR project, this is a great resource for you.) Each part listed below is 5 points, for a total of 50 points for the assignment. 1. Install the package BatchGetSymbols and load it using the libraryl) function. (If you didn't do so while watching the lecture videos, do the same for geplot2 and xlsx). Download the file tickerr.R that comes with your assignment this week. Go to its directory and run tickerr(). This will create a data frame sp500.2017.df which has closing price information for all of the S&P 500 stocks so far in 2017. You may need to wait a few minutes for all the information to be downloaded. You will also get a vector called tickers which has the list of tickers for all the stocks in the S&P 500. Use summary() to examine sp500.2017.df. 2. 3. Describe the data and how it is arranged in the data frame. ??)?? Points will be deducted (up to 10%) you do not follow all the specs listed here. Following coding and submission specs is an important aspect to writing code, especially in Rl Questions: We are continuing with the stock market as our theme for the week. For those of you interested in finance, there are a number of ereat packages in R for collecting financial data, doing time series and other analyses, and financial data visualization. A great resource for these packages is https://eran.r-project.ora/web/views/Finance.html One of my favorite R packages for finance is BatchGetSymbols. Most typical sources of stock prices, such as YahoolFinance or Google, only give you access to one stock ticker at a time. This packages allows you to provide a list of tickers and then saves all their data in a data frame. It also has commands for downloading all the tickers in a particular index, such as the S&P 500. (If you are looking for data for a FIN or OPR project, this is a great resource for you.) Each part listed below is 5 points, for a total of 50 points for the assignment. 1. Install the package BatchGetSymbols and load it using the libraryl) function. (If you didn't do so while watching the lecture videos, do the same for geplot2 and xlsx). Download the file tickerr.R that comes with your assignment this week. Go to its directory and run tickerr(). This will create a data frame sp500.2017.df which has closing price information for all of the S&P 500 stocks so far in 2017. You may need to wait a few minutes for all the information to be downloaded. You will also get a vector called tickers which has the list of tickers for all the stocks in the S&P 500. Use summary() to examine sp500.2017.df. 2. 3. Describe the data and how it is arranged in the data frame. ??)
