Answered step by step
Verified Expert Solution
Link Copied!

Question

1 Approved Answer

Pollini et al. (2015) investigate various aspects of marijuana decriminalization on California drivers. In table 3 of this paper, in the 2012 column, the authors

Pollini et al. (2015) investigate various aspects of marijuana

decriminalization on California drivers. In table 3 of this paper, in the

2012 column, the authors report a confidence interval of (20.2, 49.8).

Give a proper interpretation of this confidence interval, in the context of

the problem. (You may need to read some other parts of this paper to

properly interpret the meaning.).

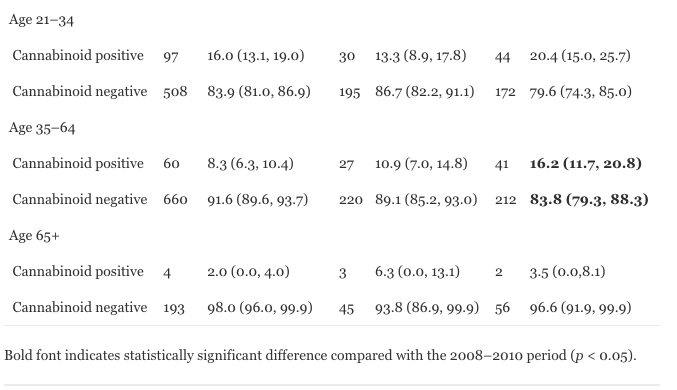
Table 3 is attached below:
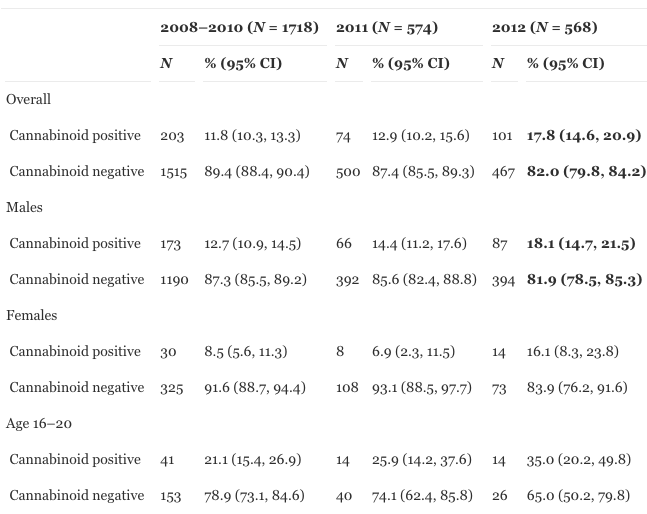
image text in transcribedimage text in transcribed
2008-2010 (N = 1718) 2011 (N = 574) 2012 (N = 568) N % (95% CI) N % (95% CI) N % (95% CI) Overall Cannabinoid positive 203 11.8 (10.3, 13.3) 74 12.9 (10.2, 15.6) 101 17.8 (14.6, 20.9) Cannabinoid negative 1515 89.4 (88.4, 90.4) 500 87.4 (85.5, 89.3) 467 82.0 (79.8, 84.2) Males Cannabinoid positive 173 12.7 (10.9, 14.5) 66 14.4 (11.2, 17.6) 87 18.1 (14.7, 21.5) Cannabinoid negative 1190 87.3 (85.5, 89.2) 392 85.6 (82.4, 88.8) 394 81.9 (78.5, 85-3) Females Cannabinoid positive 30 8.5 (5.6, 11.3) 8 6.9 (2.3, 11.5) 14 16.1 (8.3, 23.8) Cannabinoid negative 325 91.6 (88.7, 94.4) 108 93.1 (88.5, 97.7) 73 83.9 (76.2, 91.6) Age 16-20 Cannabinoid positive 41 21.1 (15-4, 26.9) 14 25.9 (14.2, 37.6) 14 35.0 (20.2, 49.8) Cannabinoid negative 153 78.9 (73.1, 84.6) 40 74.1 (62.4, 85.8) 26 65.0 (50.2, 79.8)Age 21-34 Cannabinoid positive 97 16.0 (13.1, 19.0) 30 13.3 (8.9, 17.8) 44 20.4 (15.0, 25.7) Cannabinoid negative 508 83.9 (81.0, 86.9) 195 86.7 (82.2, 91.1) 172 79.6 (74-3, 85.0) Age 35-64 Cannabinoid positive 60 8.3 (6.3, 10.4) 27 10.9 (7.0, 14.8) 41 16.2 (11.7, 20.8) Cannabinoid negative 660 91.6 (89.6, 93.7) 220 89.1 (85.2, 93.0) 212 83.8 (79.3, 88.3) Age 65+ Cannabinoid positive 4 2.0 (0.0, 4.0) 3 6.3 (0.0, 13.1) 2 3.5 (0.0,8.1) Cannabinoid negative 193 98.0 (96.0, 99.9) 45 93.8 (86.9, 99.9) 56 96.6 (91.9, 99.9) Bold font indicates statistically significant difference compared with the 2008-2010 period (p

Step by Step Solution

There are 3 Steps involved in it

Step: 1

blur-text-image

Get Instant Access to Expert-Tailored Solutions

See step-by-step solutions with expert insights and AI powered tools for academic success

Step: 2

blur-text-image_2

Step: 3

blur-text-image_3

Ace Your Homework with AI

Get the answers you need in no time with our AI-driven, step-by-step assistance

Get Started

Recommended Textbook for

Finite Math And Applied Calculus

Authors: Stefan Waner, Steven Costenoble

6th Edition

1285415132, 9781285415130

More Books

Students also viewed these Mathematics questions

Question

Q.1. Taxonomic classification of peafowl, Tiger and cow ?

Answered: 1 week ago

Question

Q .1. Different ways of testing the present adulterants ?

Answered: 1 week ago

Question

Q.1. Health issues caused by adulteration data ?

Answered: 1 week ago

Question

1. Identify three approaches to culture.

Answered: 1 week ago

Question

2. Define communication.

Answered: 1 week ago

Question

4. Describe how cultural values influence communication.

Answered: 1 week ago