Answered step by step
Verified Expert Solution
Question
1 Approved Answer
Population data: 105, 82, 94.5 ,72.5, 92, 91, 52, 86, 100,96, 98, 109, 96, 55, 18 Grading chart: A:9; B:2; C:1; D:0; F:3 Q21. Considering

Population data: 105, 82, 94.5 ,72.5, 92, 91, 52, 86, 100,96, 98, 109, 96, 55, 18
Grading chart: A:9; B:2; C:1; D:0; F:3
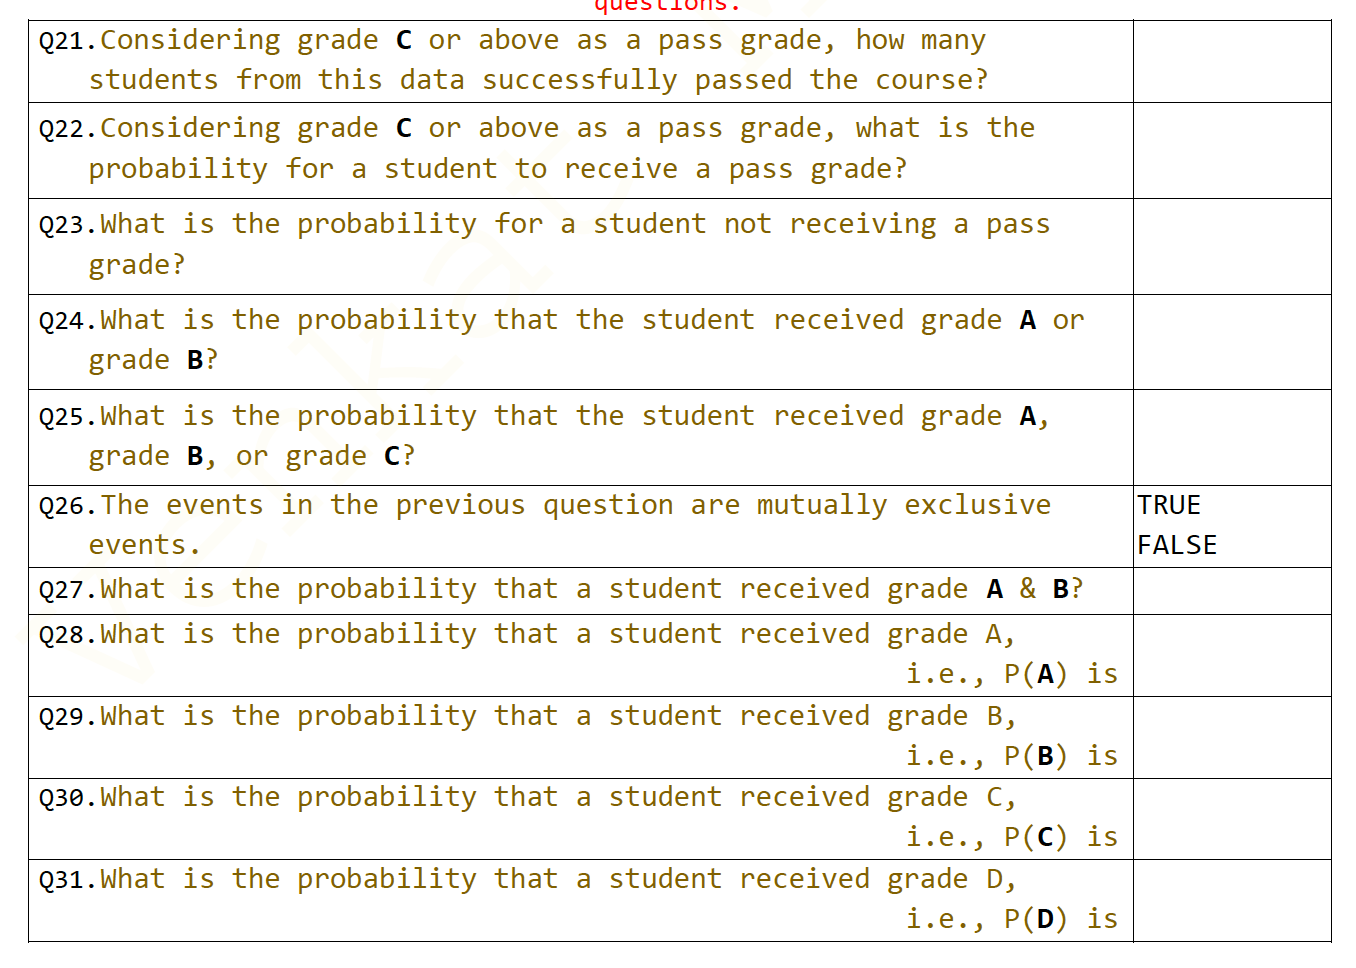
Q21. Considering grade C or above as a pass grade, how many students from this data successfully passed the course? Q22. Considering grade C or above as a pass grade, what is the probability for a student to receive a pass grade? Q23. What is the probability for a student not receiving a pass grade? Q24. What is the probability that the student received grade A or grade B? Q25. What is the probability that the student received grade A, grade B, or grade C? Q26. The events in the previous question are mutually exclusive events. Q27. What is the probability that a student received grade A & B? Q28. What is the probability that a student received grade A, i.e., P(A) is Q29. What is the probability that a student received grade B, Q30. What is the i.e., P(B) is probability that a student received grade C, i.e., P(C) is Q31. What is the probability that a student received grade D, i.e., P(D) is TRUE FALSE
Step by Step Solution
★★★★★
3.31 Rating (154 Votes )
There are 3 Steps involved in it
Step: 1
21 Number of students who passed the course A B C 921 12 22 Ppass ...
Get Instant Access to Expert-Tailored Solutions
See step-by-step solutions with expert insights and AI powered tools for academic success
Step: 2

Step: 3

Ace Your Homework with AI
Get the answers you need in no time with our AI-driven, step-by-step assistance
Get Started


