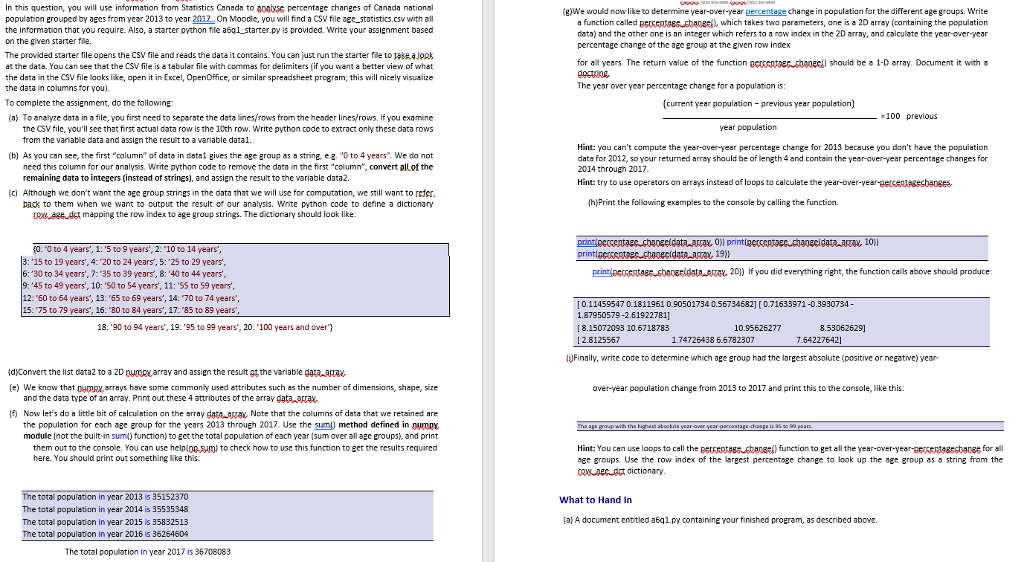
| "Population estimates on July 1st | by age and sex" 1 2 3 4 | | | |
| Annual | | | | | | |
| Table: 17-10-0005-01 (formerly CANSIM 051-0001) | | |
| Geography: Canada, Province or territory | | | |
| | | | | | | |
| | Canada | | | | | |
| | Both sexes | | | | |
| Age group | 2013 | 2014 | 2015 | 2016 | 2017 | |
| | Persons | | | | | |
| 0 to 4 years | 1,918,924 | 1,921,123 | 1,924,604 | 1,942,022 | 1,953,040 | |
| 5 to 9 years | 1,882,687 | 1,918,323 | 1,952,041 | 1,985,144 | 2,003,143 | |
| 10 to 14 years | 1,868,495 | 1,865,818 | 1,864,760 | 1,886,340 | 1,920,898 | |
| 15 to 19 years | 2,178,288 | 2,137,784 | 2,097,043 | 2,066,404 | 2,056,445 | |
| 20 to 24 years | 2,445,559 | 2,470,054 | 2,460,317 | 2,467,287 | 2,476,338 | |
| 25 to 29 years | 2,408,813 | 2,437,377 | 2,464,184 | 2,515,993 | 2,574,384 | |
| 30 to 34 years | 2,434,220 | 2,479,427 | 2,499,523 | 2,529,348 | 2,553,635 | |
| 35 to 39 years | 2,326,722 | 2,367,428 | 2,401,531 | 2,455,403 | 2,506,165 | |
| 40 to 44 years | 2,371,026 | 2,358,616 | 2,349,528 | 2,345,732 | 2,364,959 | |
| 45 to 49 years | 2,568,593 | 2,492,188 | 2,432,391 | 2,415,365 | 2,405,165 | |
| 50 to 54 years | 2,754,559 | 2,774,291 | 2,763,386 | 2,711,448 | 2,640,429 | |
| 55 to 59 years | 2,501,797 | 2,557,158 | 2,602,741 | 2,653,893 | 2,683,302 | |
| 60 to 64 years | 2,110,161 | 2,167,664 | 2,234,388 | 2,300,327 | 2,374,636 | |
| 65 to 69 years | 1,747,711 | 1,831,749 | 1,911,216 | 1,976,211 | 1,997,090 | |
| 70 to 74 years | 1,256,700 | 1,315,039 | 1,371,962 | 1,438,585 | 1,547,668 | |
| 75 to 79 years | 947,393 | 973,989 | 1,000,838 | 1,035,621 | 1,077,431 | |
| 80 to 84 years | 729,397 | 738,240 | 745,302 | 753,852 | 763,413 | |
| 85 to 89 years | 452,747 | 464,667 | 477,845 | 492,434 | 504,232 | |
| 90 to 94 years | 199,304 | 211,417 | 220,767 | 228,925 | 236,012 | |
| 95 to 99 years | 43,763 | 47,330 | 52,381 | 58,120 | 63,078 | |
| 100 years and over | 5,511 | 5,666 | 5,765 | 6,150 | 6,620 | |
In this question, you will use information from Statistics Conada to oabsc percentage changes of Canada national population grouped by ages from year 2013 to year 2012 On Moodle, you will find a CSV file age statistics.csw with all the information that you require. Also, a starter python file asql_starter.py is provided. Write your assignment based on the given starter fie The provided starter file opens the CSV file and reads the data it contains. You can just run the starter file to ase a Joak at the data. You can see that the CSV file is a tabuler file with commas for delimiters (if you want a better view of what the data in the CSV file laoks like, open it in Excel, OpenOffice, or similar spreadsheet program, this will nicely visualize the data in columns for you) To complete the assignment, do the following )We would now like to determine percentage change in population for the different age groups. Write a function called peucetes.cba), which takes two perameters, ane is a 2D array (containing the population data) and the other one is an integer which refers to a row index in the 2D array, and calculate the year-over-year percentagc change of the age group at the given row index for all years. The return value of the function percsRtoeche should be a1-D array. Document it with a The year over year percentage change for a population is: (current year population-previous year populatian) (a) To analyze data in a file, you first need to separate the data lines/rows from the hesder lines/rows. If you examine x100 previous year population the CSV file, you'll see that first actual data row is the 10th row. Write python code to extract only these data rows from the variable data and assign the result to a variable datal Hint: you can't compute the year-aver-year percentage change for 2013 because you don't have the population data for 2012, so your returned array should be of length 4 and contain the year-aver-year percentage changes for 2014 through 2017 (b) As you can see, the first "column" of data in datal gives the age group as a string, eg, "O to 4 years. We do not need this column for our analysis. Write python code to remove the data in the first "column, convert ollof the remaining data to integers (instead of strings), and assign the result to the variable data2. Although we don't want the age group strings in the dat back to them when we want to output the result of our analysis. Write python code to define a dictionary Hint: try to use operators an arrays instead af loops to calculate the year-over-year-eerceptesecbapse8 ( that we wi" use for computation, we still want to refer. h)Print the follawing examples to the console by calling the function. wildged mapping the row index to age group strings. The dictionary should look like. 0."0 to 4 years', 1: '5 to 9 years', 2: "10 to 14 years : '15 to 19 years. 4 '20 to 24 years, 5: '25 to 29 years : '30 to 34 years', 7: 35 to 39 ycars', 8: "40 to 44 ycars per eso aee stareeidatanw 20)) lf you did everything right, the function calls above should produce: 45 to 49 years', 10: "50 to 54 years', 11: 'SS to 59 years' 60 to 64 years', 13: "65 to 69 years', 14: 70 to 74 years', 0.11459547 01811961 0.90501734 0.567346821 [0.71633971-0.3930734 1.87950579-2.61922781 8.15072093 10.6718783 12.8125567 15: 75 to 79 years', 16: "80 tO 84 years, 17: 85 to 89 18: '90 to4 years, 19:'95 to 99 years', 20: '100 years and over 10.95626277 8.53062629] 1.74726433 6.5782307 7.642276421 0Finally, write code to determine which age eroup had the largest absolute (positive or negotive) year dConvert the list data2 to a 2D pumparray and assign the result gt the variable data ara e) We knaw that peRaas have some commonly used attributes such as the number af dimensians, shape, size over-year population change from 2013 to 2017 and print this to the console, like this and the data type of an array. Print out these 4 attributes of the array data arrax Now let's do a little bit of calculation on the array datNote that the columns of data that we retained are the population for coch age group for the years 2013 through 2017. Use the sum method defined in oumpy module (not the butt-in sum() function) to get the total population of each year Isum over all age groups), and print them out to the console. You can use helplop sum to check how to use this function to get the results required int: You can use loops to call the pebans) function to get ell the year-over-year-eeeebse for all nge Eroups Use the row index of the largest percentage change to look up the age eroup as string from the here. You should print out something ike this e total population in year 2013 is 35152370 The tatal population in year 2014 is 35535348 The total population in year 2015 is 35832513 The total population in year 2016 Is 36264604 What to Hand In (a) A document entitled a6q1.py containing your finished program, as described above. The total population in year 2017 is 36708083 In this question, you will use information from Statistics Conada to oabsc percentage changes of Canada national population grouped by ages from year 2013 to year 2012 On Moodle, you will find a CSV file age statistics.csw with all the information that you require. Also, a starter python file asql_starter.py is provided. Write your assignment based on the given starter fie The provided starter file opens the CSV file and reads the data it contains. You can just run the starter file to ase a Joak at the data. You can see that the CSV file is a tabuler file with commas for delimiters (if you want a better view of what the data in the CSV file laoks like, open it in Excel, OpenOffice, or similar spreadsheet program, this will nicely visualize the data in columns for you) To complete the assignment, do the following )We would now like to determine percentage change in population for the different age groups. Write a function called peucetes.cba), which takes two perameters, ane is a 2D array (containing the population data) and the other one is an integer which refers to a row index in the 2D array, and calculate the year-over-year percentagc change of the age group at the given row index for all years. The return value of the function percsRtoeche should be a1-D array. Document it with a The year over year percentage change for a population is: (current year population-previous year populatian) (a) To analyze data in a file, you first need to separate the data lines/rows from the hesder lines/rows. If you examine x100 previous year population the CSV file, you'll see that first actual data row is the 10th row. Write python code to extract only these data rows from the variable data and assign the result to a variable datal Hint: you can't compute the year-aver-year percentage change for 2013 because you don't have the population data for 2012, so your returned array should be of length 4 and contain the year-aver-year percentage changes for 2014 through 2017 (b) As you can see, the first "column" of data in datal gives the age group as a string, eg, "O to 4 years. We do not need this column for our analysis. Write python code to remove the data in the first "column, convert ollof the remaining data to integers (instead of strings), and assign the result to the variable data2. Although we don't want the age group strings in the dat back to them when we want to output the result of our analysis. Write python code to define a dictionary Hint: try to use operators an arrays instead af loops to calculate the year-over-year-eerceptesecbapse8 ( that we wi" use for computation, we still want to refer. h)Print the follawing examples to the console by calling the function. wildged mapping the row index to age group strings. The dictionary should look like. 0."0 to 4 years', 1: '5 to 9 years', 2: "10 to 14 years : '15 to 19 years. 4 '20 to 24 years, 5: '25 to 29 years : '30 to 34 years', 7: 35 to 39 ycars', 8: "40 to 44 ycars per eso aee stareeidatanw 20)) lf you did everything right, the function calls above should produce: 45 to 49 years', 10: "50 to 54 years', 11: 'SS to 59 years' 60 to 64 years', 13: "65 to 69 years', 14: 70 to 74 years', 0.11459547 01811961 0.90501734 0.567346821 [0.71633971-0.3930734 1.87950579-2.61922781 8.15072093 10.6718783 12.8125567 15: 75 to 79 years', 16: "80 tO 84 years, 17: 85 to 89 18: '90 to4 years, 19:'95 to 99 years', 20: '100 years and over 10.95626277 8.53062629] 1.74726433 6.5782307 7.642276421 0Finally, write code to determine which age eroup had the largest absolute (positive or negotive) year dConvert the list data2 to a 2D pumparray and assign the result gt the variable data ara e) We knaw that peRaas have some commonly used attributes such as the number af dimensians, shape, size over-year population change from 2013 to 2017 and print this to the console, like this and the data type of an array. Print out these 4 attributes of the array data arrax Now let's do a little bit of calculation on the array datNote that the columns of data that we retained are the population for coch age group for the years 2013 through 2017. Use the sum method defined in oumpy module (not the butt-in sum() function) to get the total population of each year Isum over all age groups), and print them out to the console. You can use helplop sum to check how to use this function to get the results required int: You can use loops to call the pebans) function to get ell the year-over-year-eeeebse for all nge Eroups Use the row index of the largest percentage change to look up the age eroup as string from the here. You should print out something ike this e total population in year 2013 is 35152370 The tatal population in year 2014 is 35535348 The total population in year 2015 is 35832513 The total population in year 2016 Is 36264604 What to Hand In (a) A document entitled a6q1.py containing your finished program, as described above. The total population in year 2017 is 36708083