

Question
PORTFOLIO ANALYSIS: Jane is considering investing in three different securities or creating three distinctive two-factor portfolios. She is able to obtain the monthly returns of
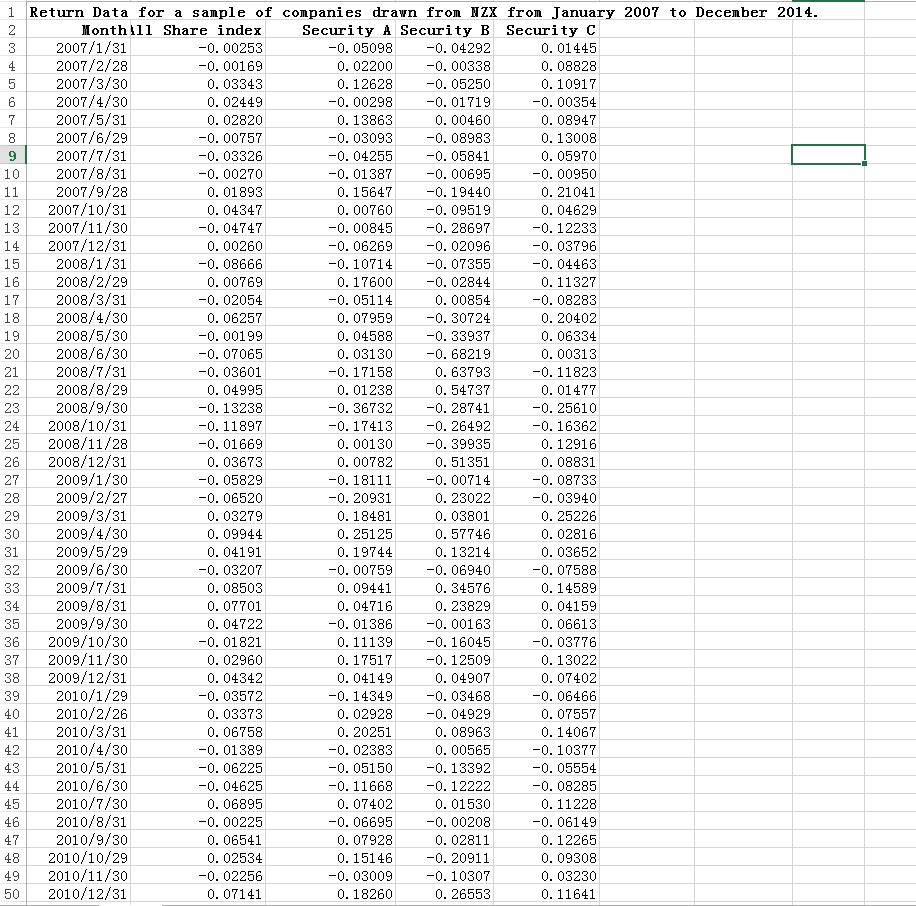
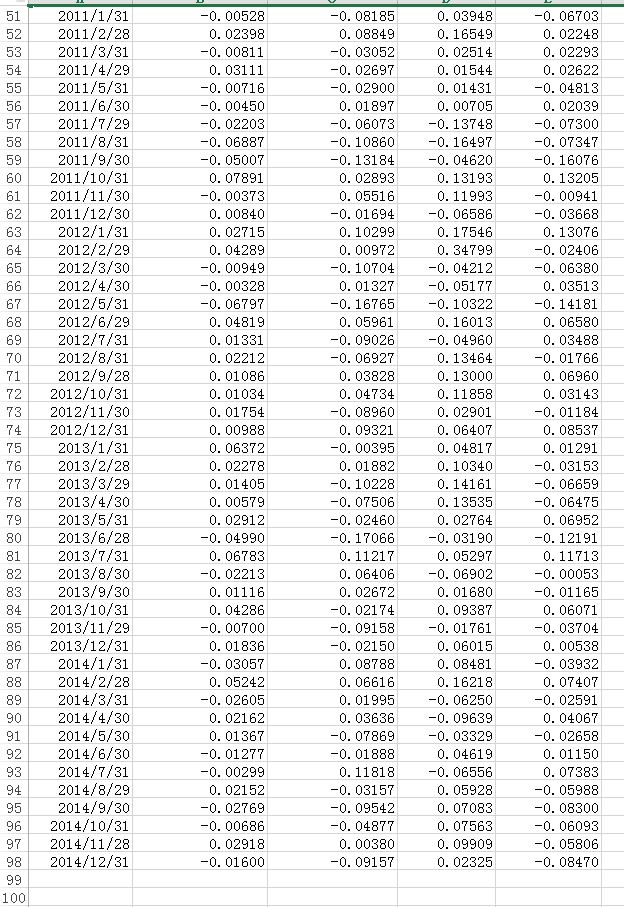
PORTFOLIO ANALYSIS: Jane is considering investing in three different securities or creating three distinctive two-factor portfolios. She is able to obtain the monthly returns of securities A, B & C for the years 2007 to 2014 (The upload file (Stock returns 2007-14) gives 96 monthly returns for three securities along with the returns of the NZX all share index for the period January 2007 and December 2014). In any of the possible two factor portfolios, the weight of each security in the portfolio will be 50%. The three possible portfolio combinations are AB, AC and BC. Required:
a) Determine, using the appropriate Excel function (see attachment) the average monthly return, the standard deviation and variance for each of the companies. (Use the 96 months returns data in the calculations and use the Excel functions identified as Variance P and Standard Deviation P.)
b) Determine, using the appropriate Excel function the covariances between securities A&B; B&C; A&C. (Use the 96 months returns data in the calculations and use the Excel functionCOVARIANCE P.)
c) Calculate using the two-factor portfolio equations, the portfolio returns and risks (standard deviation and variance) for the following portfolios:
a. A and B
b. B and C
c. C and A
d) Would you recommend that Jane invest in the single securities of A, B or C or the portfolios consisting of securities A&B or A&C or B&C? Explain your answer from a risk-return view point.
e) Determine the betas Security A, a utility company, security B, a construction company, and security C, a manufacturing company by regressing the returns foreach of the companies on the returns for the NZX ALL Share Index (the first column in the spread-sheet).
(Regression Calculation: Go to Data Analysis - far right under Data- and choose regression. If Data Analysis does not appear it must be added, it will be available in Excel. Go to Options under File and choose Add-ins and then Data Analysis the company returns constitute the Y input and the index returns the X input. Alternatively, the slope found in f(x) also represents Beta).
a. Explain what the values of the betas (the slope coefficients in the regression) indicate and discuss the factors that might explain the differences in the values of the betas of the three companies.
b. Comment on the implications of the estimated value of beta for investors and the cost of capital for the three companies.
Step by Step Solution
There are 3 Steps involved in it
Step: 1

Get Instant Access to Expert-Tailored Solutions
See step-by-step solutions with expert insights and AI powered tools for academic success
Step: 2

Step: 3
Ace Your Homework with AI
Get the answers you need in no time with our AI-driven, step-by-step assistance
Get Started
The New Finance Overreaction Complexity And Their Consequences
Authors: Robert A. Haugen
4th International Edition
0132775875, 9780132775878