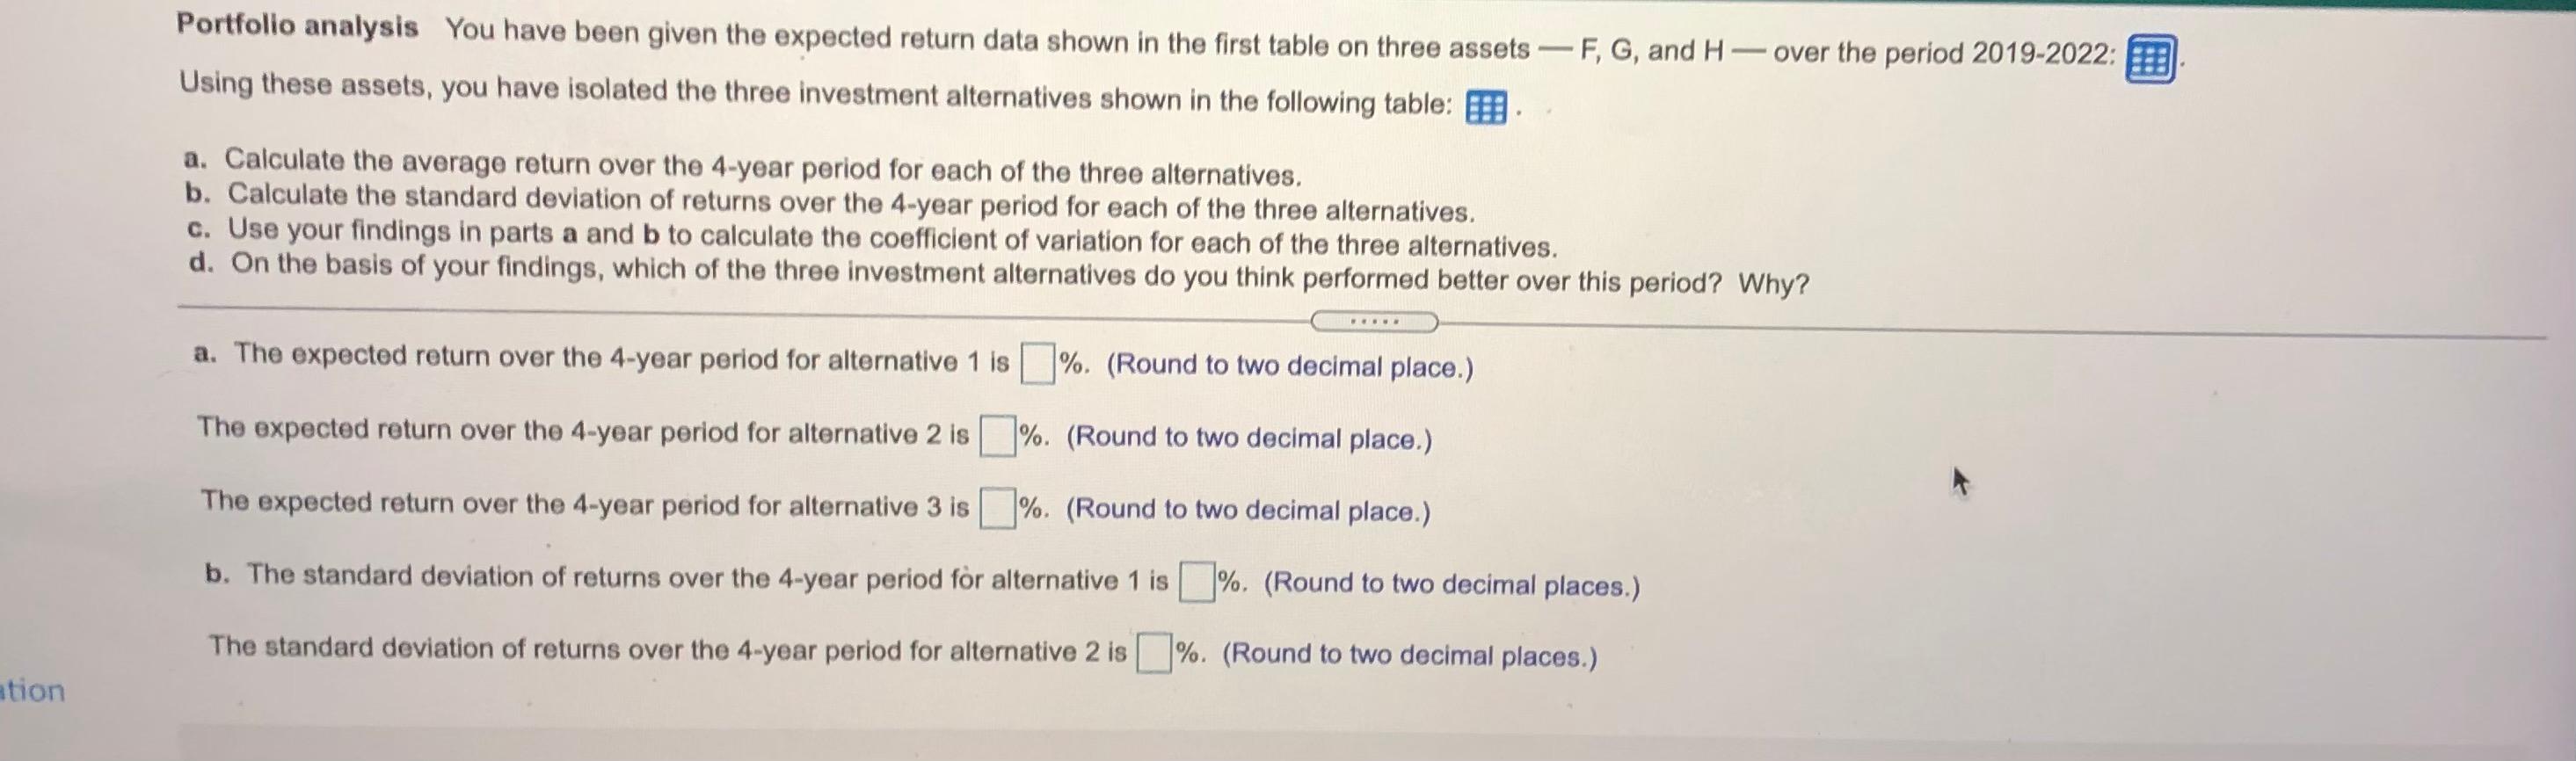
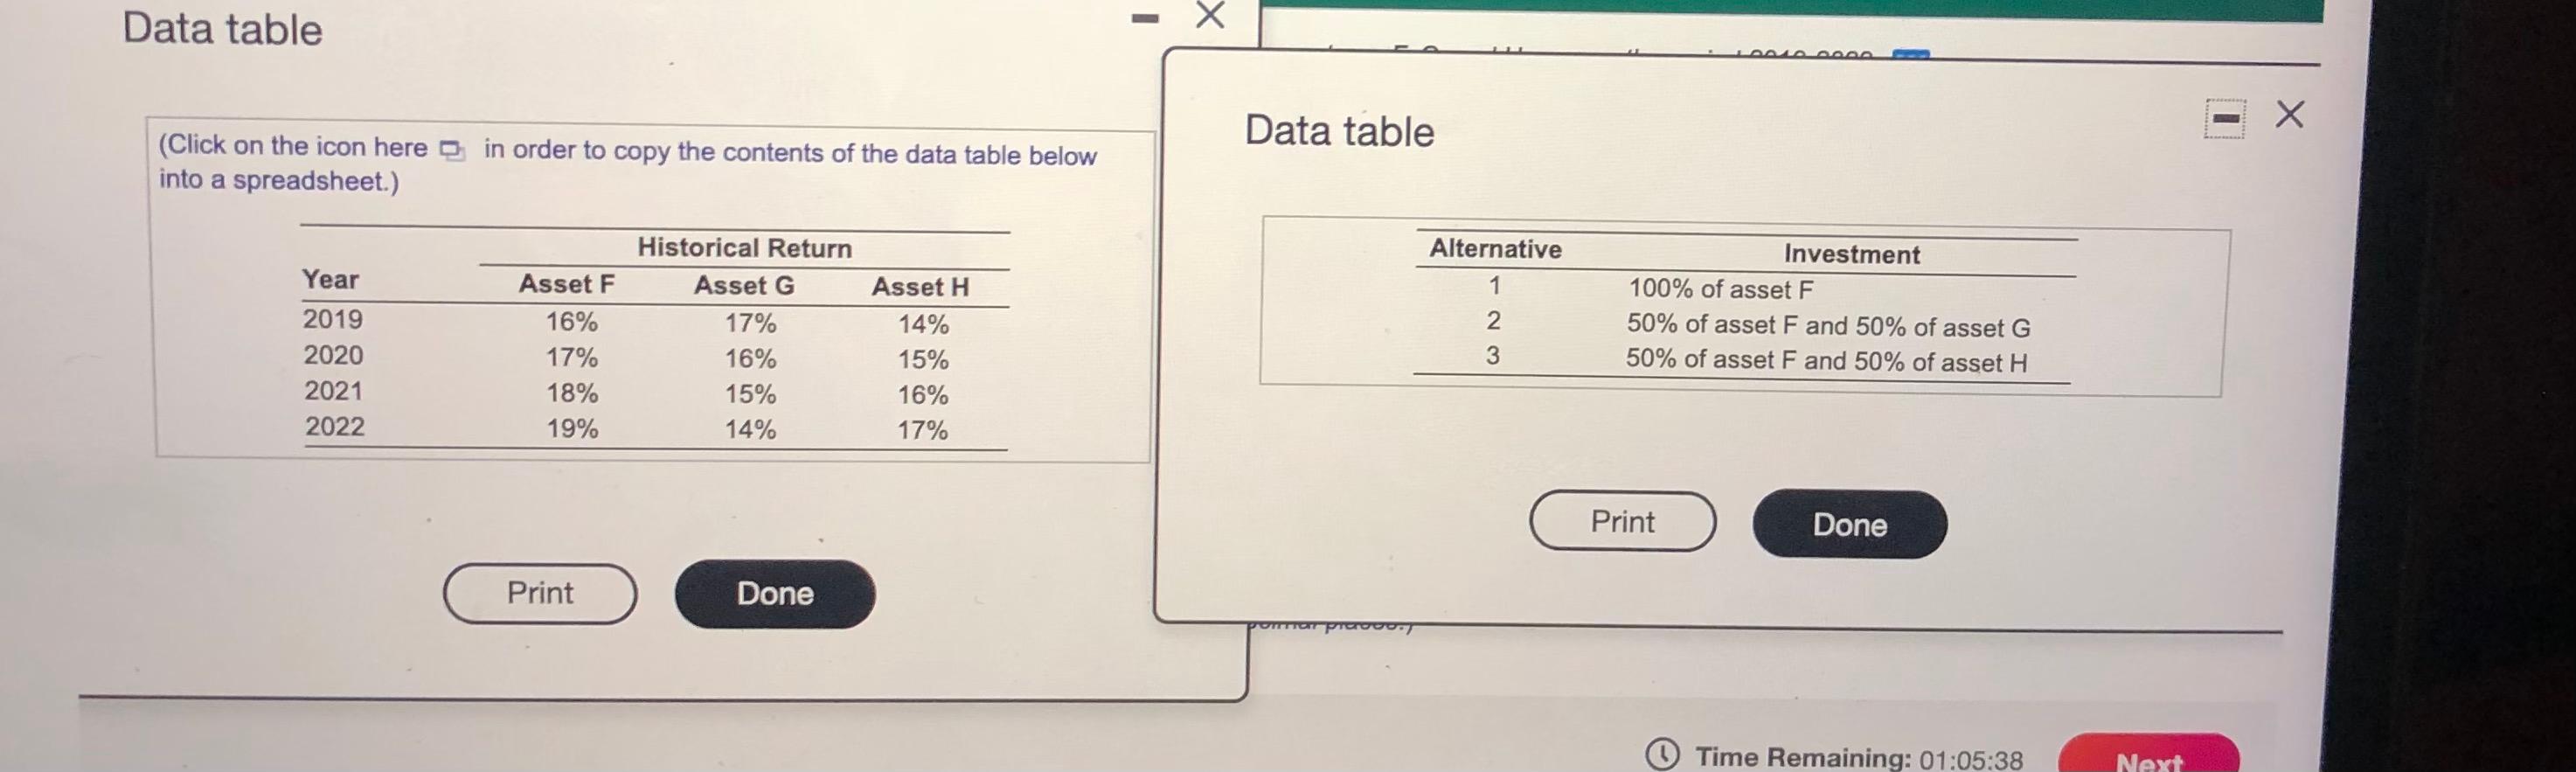
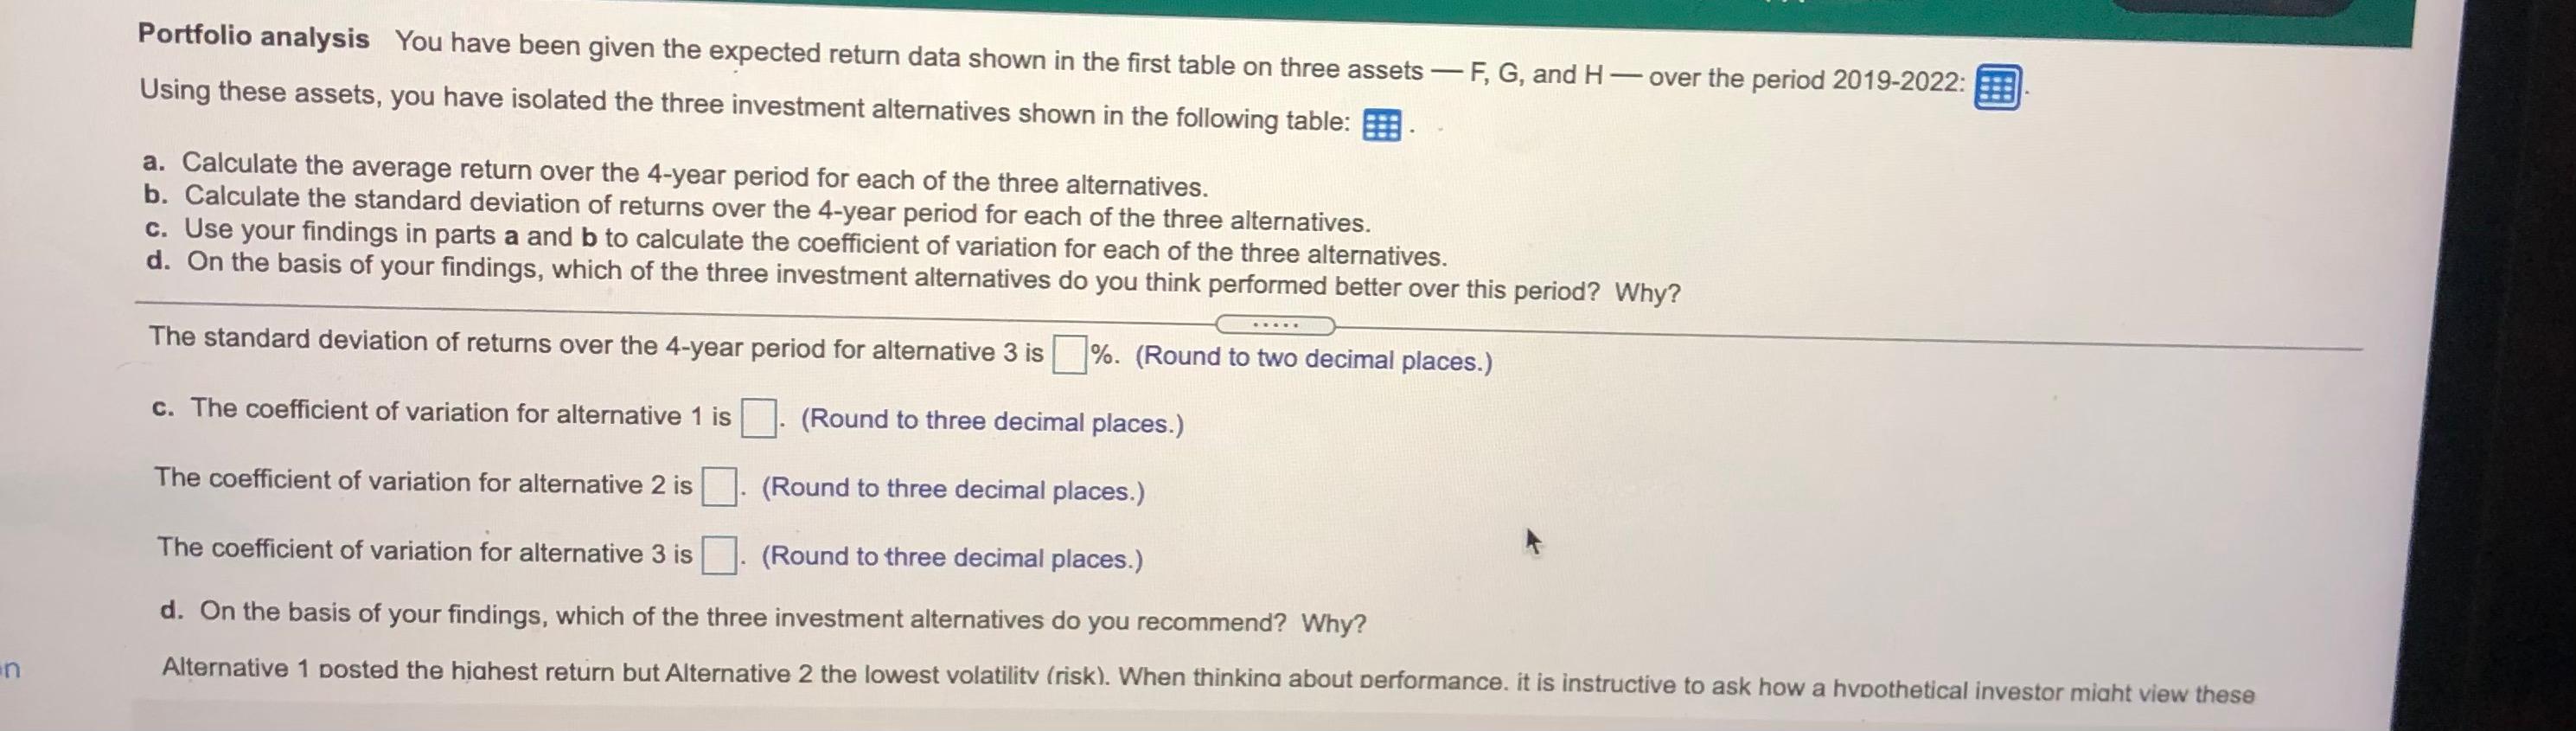
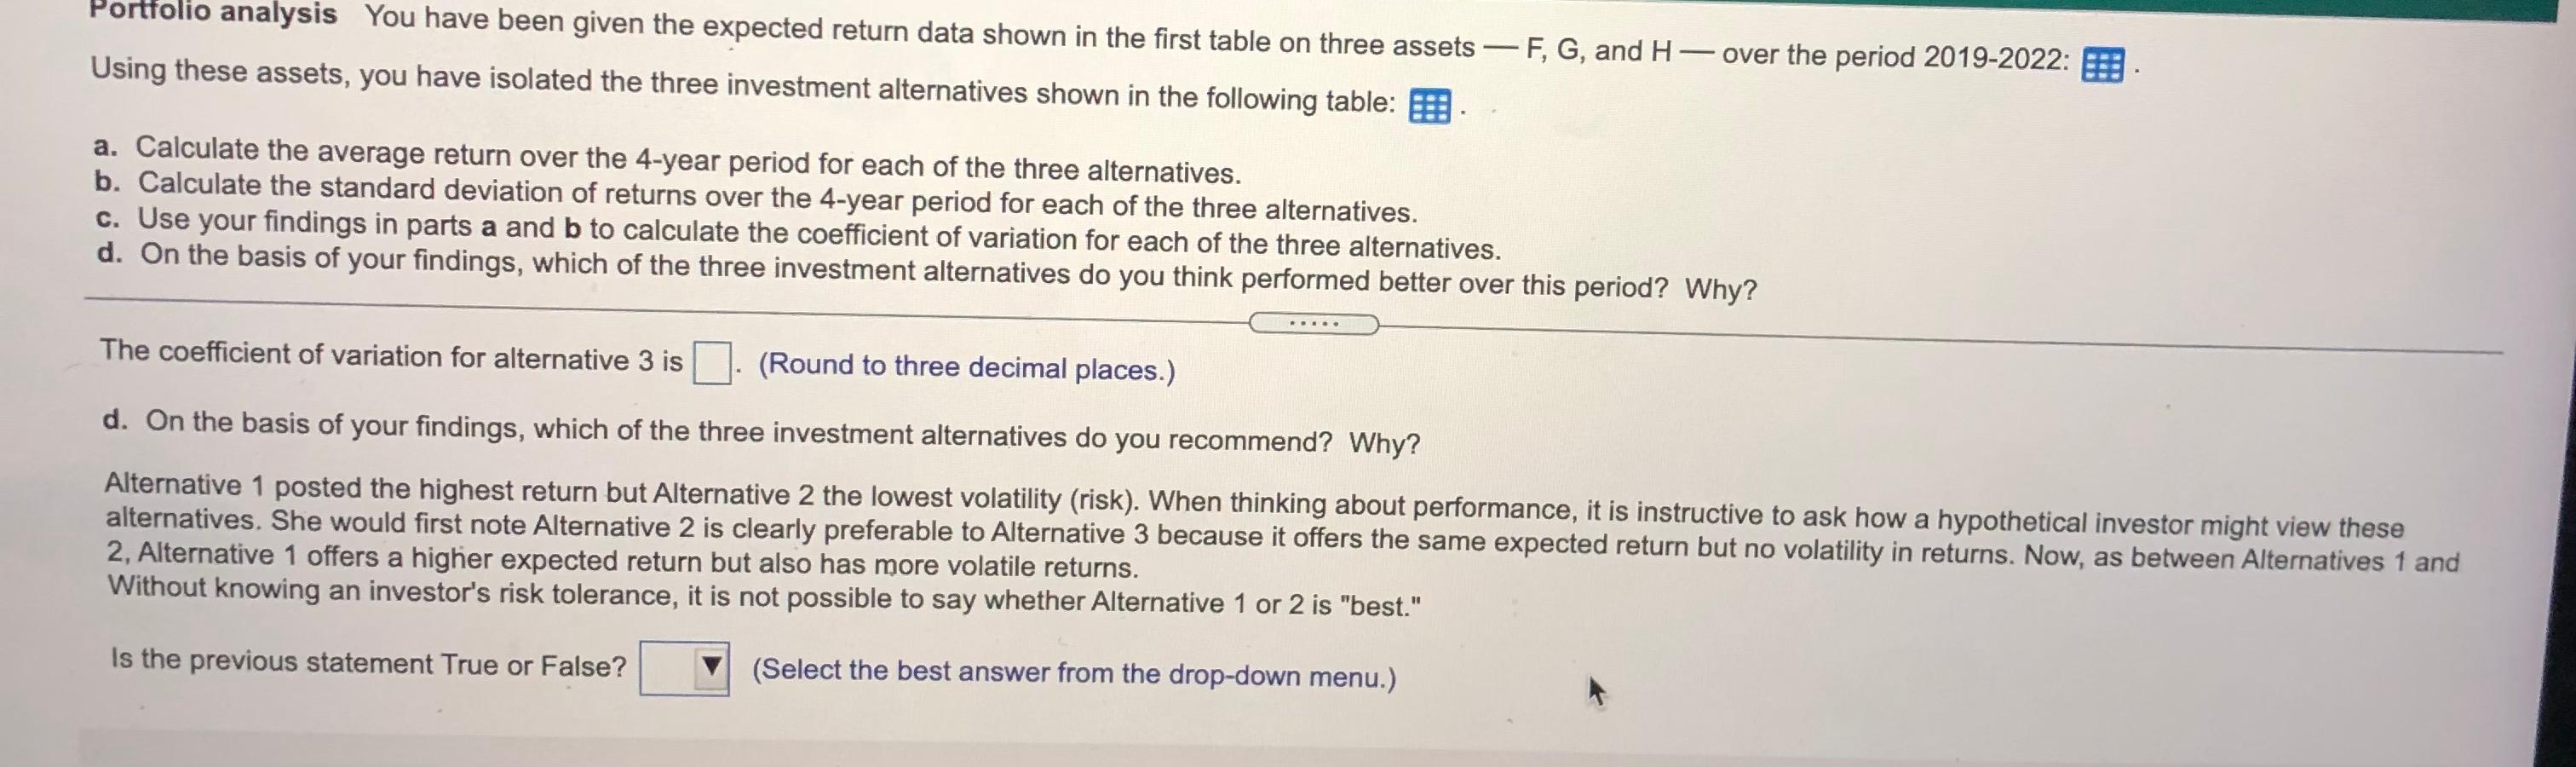
Portfolio analysis You have been given the expected return data shown in the first table on three assets F, G, and H over the period 2019-2022: Using these assets, you have isolated the three investment alternatives shown in the following table: a. Calculate the average return over the 4-year period for each of the three alternatives. b. Calculate the standard deviation of returns over the 4-year period for each of the three alternatives. c. Use your findings in parts a and b to calculate the coefficient of variation for each of the three alternatives. d. On the basis of your findings, which of the three investment alternatives do you think performed better over this period? Why? ... a. The expected return over the 4-year period for alternative 1 is %. (Round to two decimal place.) The expected return over the 4-year period for alternative 2 is %. (Round to two decimal place.) The expected return over the 4-year period for alternative 3 is %. (Round to two decimal place.) b. The standard deviation of returns over the 4-year period for alternative 1 is %. (Round to two decimal places.) The standard deviation of returns over the 4-year period for alternative 2 is %. (Round to two decimal places.) ation Data table Data table (Click on the icon here in order to copy the contents of the data table below into a spreadsheet.) Alternative 1 Year 2019 2020 2021 2022 Asset F 16% 17% 18% 19% Historical Return Asset G 17% 16% 15% 14% Asset H 14% 15% 16% 17% Investment 100% of asset F 50% of asset F and 50% of asset G 50% of asset F and 50% of asset H 2 3 W N Print Done Print Done Time Remaining: 01:05:38 Next Portfolio analysis You have been given the expected return data shown in the first table on three assets F, G, and H- over the period 2019-2022: Using these assets, you have isolated the three investment alternatives shown in the following table: a. Calculate the average return over the 4-year period for each of the three alternatives. b. Calculate the standard deviation of returns over the 4-year period for each of the three alternatives. c. Use your findings in parts a and b to calculate the coefficient of variation for each of the three alternatives. d. On the basis of your findings, which of the three investment alternatives do you think performed better over this period? Why? .... The standard deviation of returns over the 4-year period for alternative 3 is %. (Round to two decimal places.) c. The coefficient of variation for alternative 1 is (Round to three decimal places.) The coefficient of variation for alternative 2 is (Round to three decimal places.) The coefficient of variation for alternative 3 is (Round to three decimal places.) d. On the basis of your findings, which of the three investment alternatives do you recommend? Why? en Alternative 1 posted the highest return but Alternative 2 the lowest volatilitv (risk). When thinkina about performance, it is instructive to ask how a hvpothetical investor miaht view these Portfolio analysis You have been given the expected return data shown in the first table on three assets F, G, and H- over the period 2019-2022: Using these assets, you have isolated the three investment alternatives shown in the following table: a. Calculate the average return over the 4-year period for each of the three alternatives. b. Calculate the standard deviation of returns over the 4-year period for each of the three alternatives. c. Use your findings in parts a and b to calculate the coefficient of variation for each of the three alternatives. d. On the basis of your findings, which of the three investment alternatives do you think performed better over this period? Why? The coefficient of variation for alternative 3 is (Round to three decimal places.) d. On the basis of your findings, which of the three investment alternatives do you recommend? Why? Alternative 1 posted the highest return but Alternative 2 the lowest volatility (risk). When thinking about performance, it is instructive to ask how a hypothetical investor might view these alternatives. She would first note Alternative 2 is clearly preferable to Alternative 3 because it offers the same expected return but no volatility in returns. Now, as between Alternatives 1 and 2, Alternative 1 offers a higher expected return but also has more volatile returns. Without knowing an investor's risk tolerance, it is not possible to say whether Alternative 1 or 2 is "best." Is the previous statement True or False? (Select the best answer from the drop-down menu.)