

Answered step by step
Verified Expert Solution
Question
1 Approved Answer
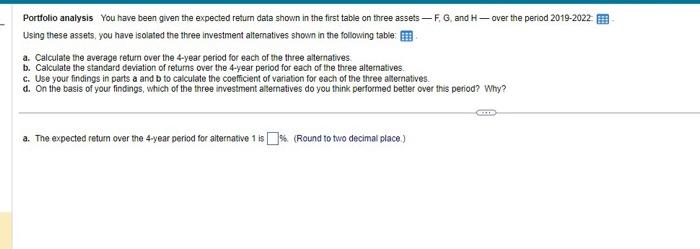
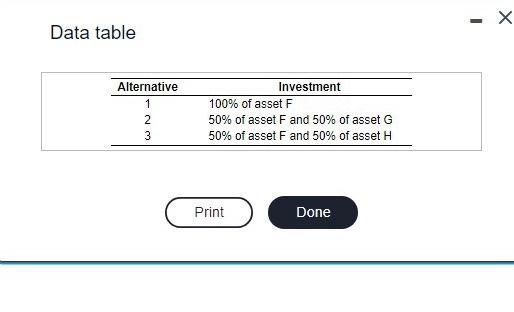
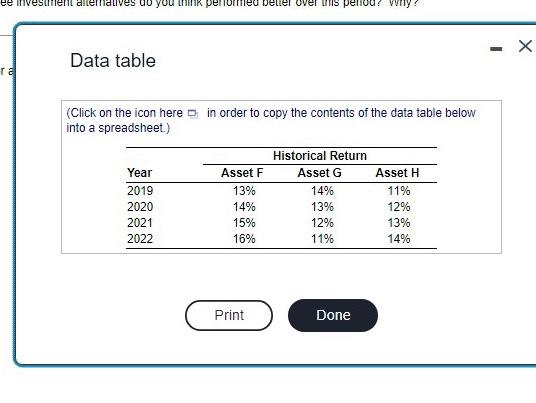
Portfolio analysis You have been given the expected return data shown in the first table on three assets - F, G, and H - over
Step by Step Solution
There are 3 Steps involved in it
Step: 1

Get Instant Access to Expert-Tailored Solutions
See step-by-step solutions with expert insights and AI powered tools for academic success
Step: 2

Step: 3
Ace Your Homework with AI
Get the answers you need in no time with our AI-driven, step-by-step assistance
Get Started
AS Accounting For AQA
Authors: David Cox,Michael Fardon
2nd Edition
1905777140, 978-1905777143