

Answered step by step
Verified Expert Solution
Question
1 Approved Answer
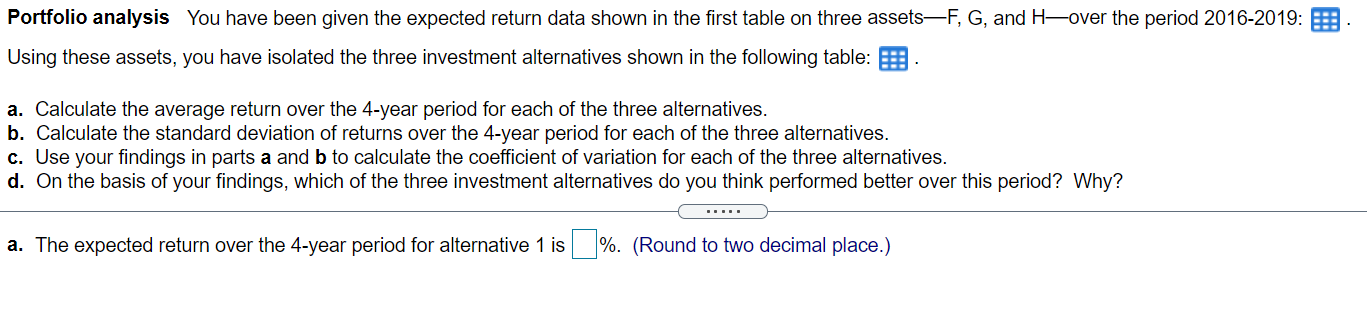
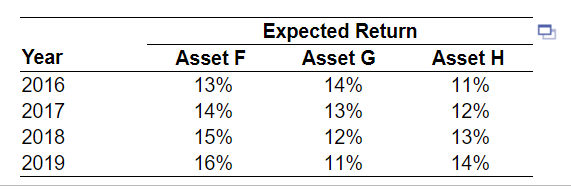
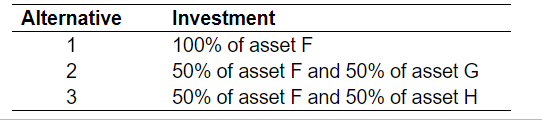
Portfolio analysis You have been given the expected return data shown in the first table on three assetsF, G, and H-over the period 2016-2019: Using
Step by Step Solution
There are 3 Steps involved in it
Step: 1

Get Instant Access to Expert-Tailored Solutions
See step-by-step solutions with expert insights and AI powered tools for academic success
Step: 2

Step: 3
Ace Your Homework with AI
Get the answers you need in no time with our AI-driven, step-by-step assistance
Get Started
Financial Markets and Institutions
Authors: Jeff Madura
12th edition
9781337515535, 1337099740, 1337515531, 978-1337099745