Answered step by step
Verified Expert Solution
Question
1 Approved Answer
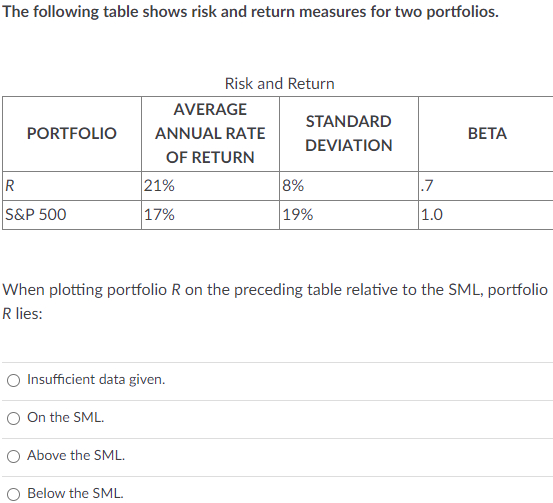
PORTFOLIO AVERAGE ANNUAL RATE OF RETURN STANDARD DEVIATION The following table shows risk and return measures for two portfolios. Risk and Return When plotting portfolio
PORTFOLIO AVERAGE ANNUAL RATE OF RETURN STANDARD DEVIATION The following table shows risk and return measures for two portfolios.
Risk and Return
When plotting portfolio on the preceding table relative to the SML portfolio
lies:
Insufficient data given.
On the SML
Above the SML
Below the SMLBETA
R
S&P
When plotting portfolio R on the preceding table relative to the SML portfolio R lies:
Insufficient data given.
On the SML
Above the SML
Below the SML

Step by Step Solution
There are 3 Steps involved in it
Step: 1

Get Instant Access to Expert-Tailored Solutions
See step-by-step solutions with expert insights and AI powered tools for academic success
Step: 2

Step: 3

Ace Your Homework with AI
Get the answers you need in no time with our AI-driven, step-by-step assistance
Get Started


