

Answered step by step
Verified Expert Solution
Question
1 Approved Answer
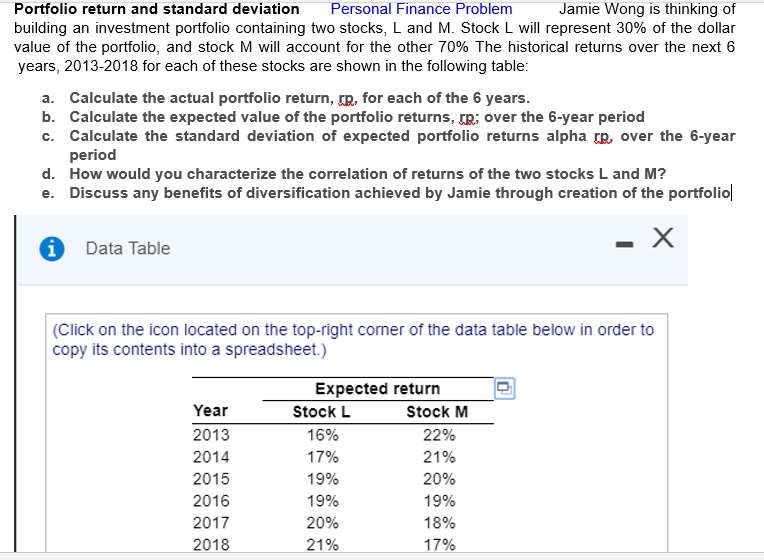
Portfolio return and standard deviation building an investment portfolio containing two stocks, L and M. Stock L will represent 30% of the dollar value of
Step by Step Solution
There are 3 Steps involved in it
Step: 1

Get Instant Access to Expert-Tailored Solutions
See step-by-step solutions with expert insights and AI powered tools for academic success
Step: 2

Step: 3
Ace Your Homework with AI
Get the answers you need in no time with our AI-driven, step-by-step assistance
Get Started
Financial Econometrics
Authors: Peijie Wang
1st Edition
0415426693, 978-0415426695