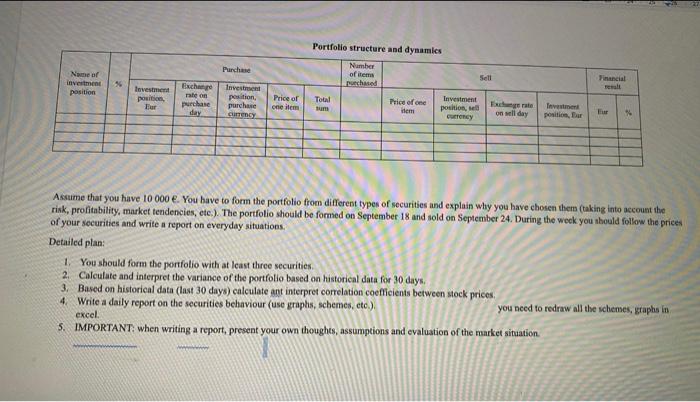
Portfolio structure and dynamics Purchase Number of items Forchased ) Name of investment position Sell * Financial remalt Investment parities Fur Exchange rate on purchase day Investment position purchase Currency Price of one item Total Price of one em Investment position, GONEY on ll day Investment position, Bar Thu Assume that you have 10 000 . You have to form the portfolio from different types of securities and explain why you have chosen them (taking into account the risk, profitability, market tendencies, etc.). The portfolio should be formed on September 18 and sold on September 24. During the week you should follow the prices of your securities and write a report on everyday situations. Detailed plan: 1. You should form the portfolio with at least three securities 2. Calculate and interpret the variance of the portfolio based on historical data for 30 days. 3. Based on historical data (last 30 days) calculate ant interpret correlation coefficients between stock prices, 4 Write a daily report on the securities behaviour (use graphs, schemes, etc.) you need to redraw all the schemes, graphs in excel 5. IMPORTANT: when writing a report, present your own thoughts, assumptions and evaluation of the market situation Portfolio structure and dynamics Purchase Number of items Forchased ) Name of investment position Sell * Financial remalt Investment parities Fur Exchange rate on purchase day Investment position purchase Currency Price of one item Total Price of one em Investment position, GONEY on ll day Investment position, Bar Thu Assume that you have 10 000 . You have to form the portfolio from different types of securities and explain why you have chosen them (taking into account the risk, profitability, market tendencies, etc.). The portfolio should be formed on September 18 and sold on September 24. During the week you should follow the prices of your securities and write a report on everyday situations. Detailed plan: 1. You should form the portfolio with at least three securities 2. Calculate and interpret the variance of the portfolio based on historical data for 30 days. 3. Based on historical data (last 30 days) calculate ant interpret correlation coefficients between stock prices, 4 Write a daily report on the securities behaviour (use graphs, schemes, etc.) you need to redraw all the schemes, graphs in excel 5. IMPORTANT: when writing a report, present your own thoughts, assumptions and evaluation of the market situation


