Answered step by step
Verified Expert Solution
Question
1 Approved Answer
Portfolio weights : A 0.5 B 0.25 C 0.25 Give your formula in excel. Question 1: Returns and Volatility (a) Using the last trading date
| Portfolio weights |
: A 0.5 B 0.25 C 0.25
Give your formula in excel.

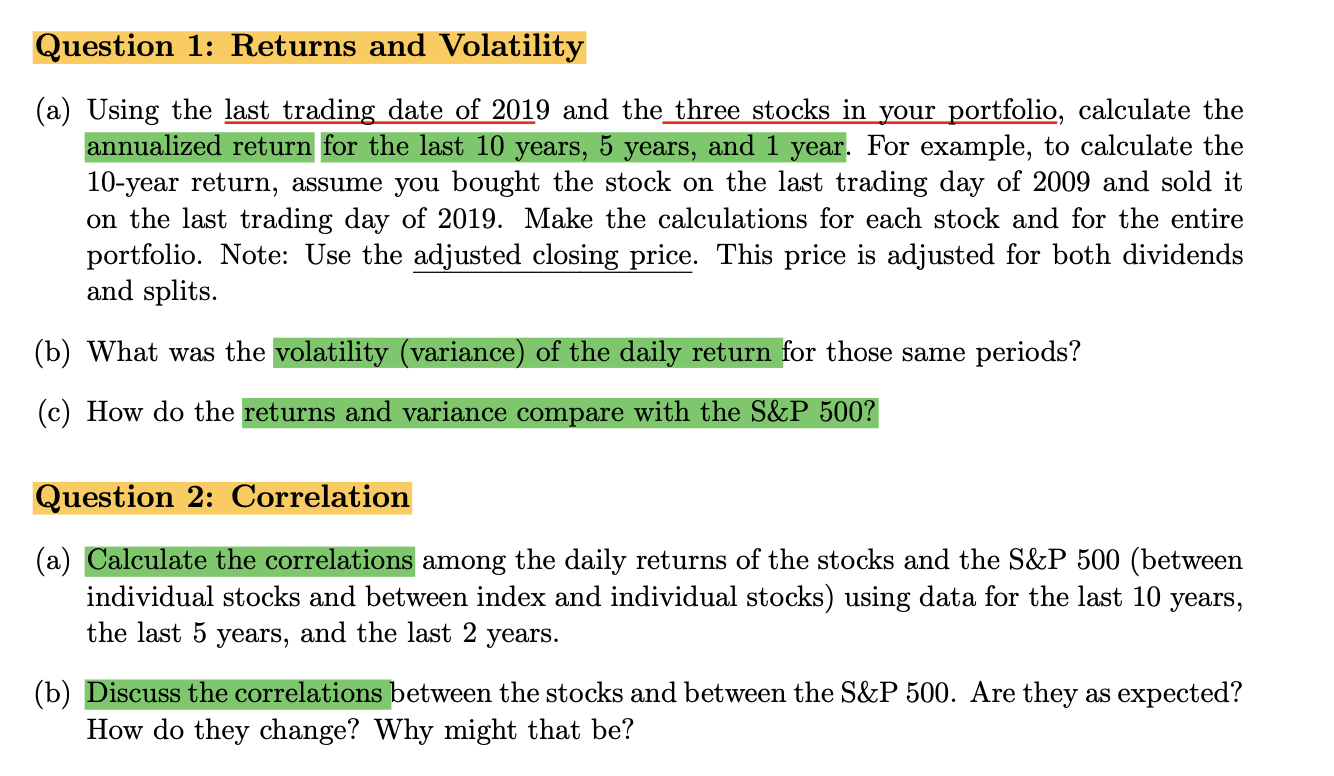
Question 1: Returns and Volatility (a) Using the last trading date of 2019 and the three stocks in your portfolio, calculate the annualized return for the last 10 years, 5 years, and 1 year. For example, to calculate the 10-year return, assume you bought the stock on the last trading day of 2009 and sold it on the last trading day of 2019. Make the calculations for each stock and for the entire portfolio. Note: Use the adjusted closing price. This price is adjusted for both dividends and splits. (b) What was the volatility (variance) of the daily return for those same periods? (c) How do the returns and variance compare with the S&P 500? Question 2: Correlation (a) Calculate the correlations among the daily returns of the stocks and the S&P 500 (between individual stocks and between index and individual stocks) using data for the last 10 years, the last 5 years, and the last 2 years. (b) Discuss the correlations between the stocks and between the S&P 500. Are they as expected? How do they change? Why might that be? Question 1: Returns and Volatility (a) Using the last trading date of 2019 and the three stocks in your portfolio, calculate the annualized return for the last 10 years, 5 years, and 1 year. For example, to calculate the 10-year return, assume you bought the stock on the last trading day of 2009 and sold it on the last trading day of 2019. Make the calculations for each stock and for the entire portfolio. Note: Use the adjusted closing price. This price is adjusted for both dividends and splits. (b) What was the volatility (variance) of the daily return for those same periods? (c) How do the returns and variance compare with the S&P 500? Question 2: Correlation (a) Calculate the correlations among the daily returns of the stocks and the S&P 500 (between individual stocks and between index and individual stocks) using data for the last 10 years, the last 5 years, and the last 2 years. (b) Discuss the correlations between the stocks and between the S&P 500. Are they as expected? How do they change? Why might that be
Step by Step Solution
There are 3 Steps involved in it
Step: 1

Get Instant Access to Expert-Tailored Solutions
See step-by-step solutions with expert insights and AI powered tools for academic success
Step: 2

Step: 3

Ace Your Homework with AI
Get the answers you need in no time with our AI-driven, step-by-step assistance
Get Started


