Answered step by step
Verified Expert Solution
Question
1 Approved Answer
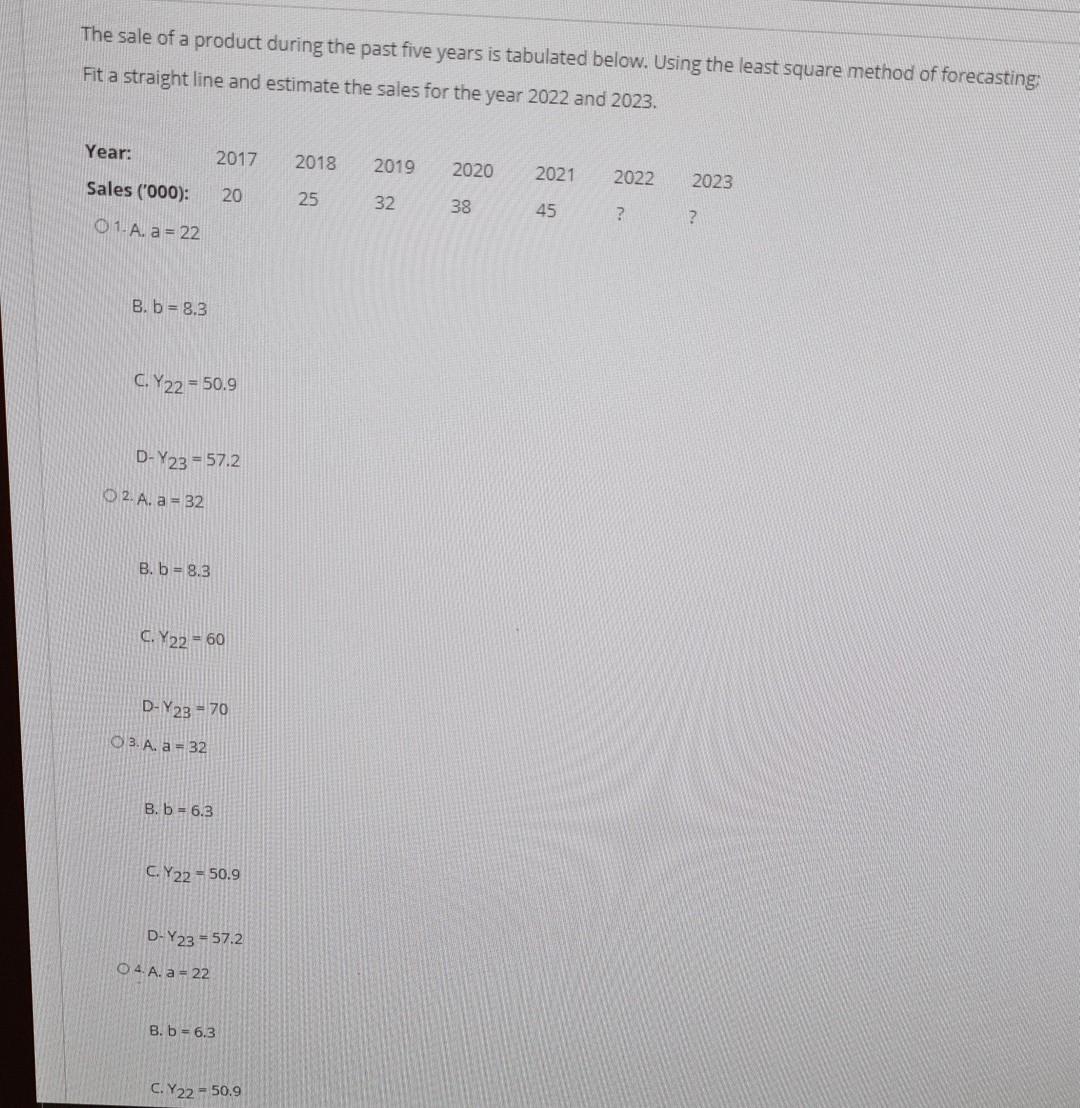
post the steps please .. The sale of a product during the past five years is tabulated below. Using the least square method of forecasting

post the steps please ..
The sale of a product during the past five years is tabulated below. Using the least square method of forecasting Fit a straight line and estimate the sales for the year 2022 and 2023. Year: 2017 2018 2019 2020 2021 2022 2023 20 Sales ('000): 01. A. a = 22 25 32 38 45 ? ? B. b = 8.3 C. Y22 = 50.9 D-Y23 = 57.2 2. A. a = 32 B. b = 8.3 C. Y22 = 60 D-Y23 = 70 O 3. A. a = 32 B. b = 6.3 C.Y22 = 50.9 D-Y23 - 57.2 O 4. A. a = 22 B. b = 6.3 C.Y22 = 50.9Step by Step Solution
There are 3 Steps involved in it
Step: 1

Get Instant Access to Expert-Tailored Solutions
See step-by-step solutions with expert insights and AI powered tools for academic success
Step: 2

Step: 3

Ace Your Homework with AI
Get the answers you need in no time with our AI-driven, step-by-step assistance
Get Started


