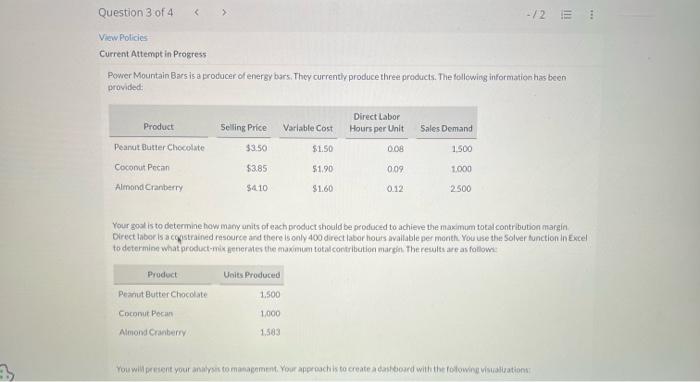
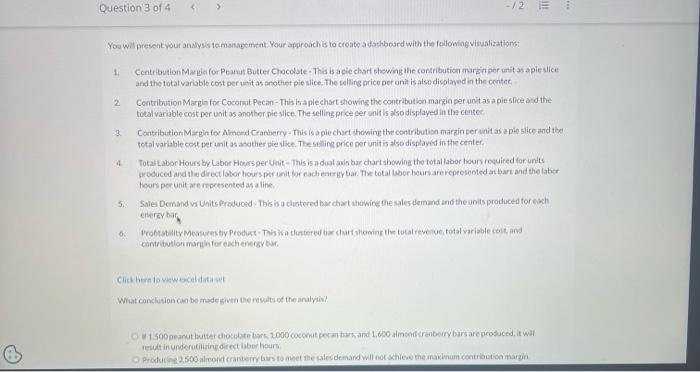
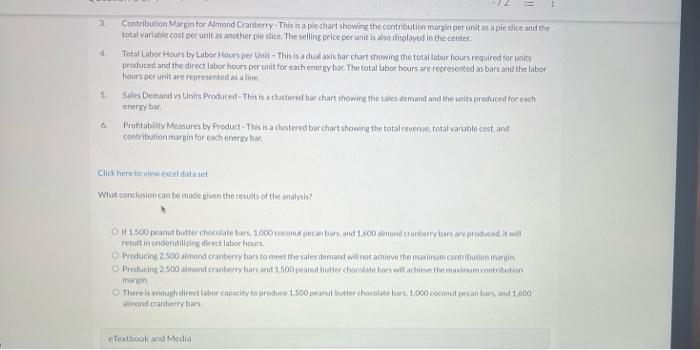
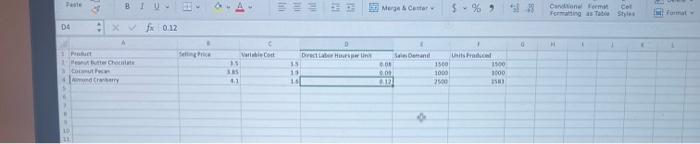
Power Mountain Bars is a producer of energy bars. They currently produce three products. The tollowing information has been provided: Your goal is to determine how many units of each product should be produced to achieve the maximum total contribubion margin. Direct tabor is a cogistraifed resource ard there is only 400 direct lator houts avallable per month. You use the Solver tunction lin Excel Yoa wil present your andiysis to management. Your approach is to create a dasthboard with the following vieualizations: 1. Contribution Margie for Peatrut Butter Chocolate - Thas is a pie chart stewing the contributicn markit per unit as apiesice and the total variable cost per unit as anetiner pie slice. The willing price per unit is alse displayed in the criter. 2. Centribution Margin for Cocomit Pecan-This is aplechart showing the contritution marckin per unit as a pieslice asd the total variable cost per unit as another pie slice. The selling price cer unit is also displayed in the centec: total variable cost per unit as acother pie tike. The stlife price per unit is alse displayed in the center. 4. Total Labor Hours by Laboe Hours per Unit - This is a dual aws tar chart showine the total labor four reequired for unts teours per unit are repectsented as a line: 5. Sales Demand vi Units Produced. Tho is a chustered bar chart thowing the sales demand and the units produced for exch erierey haf contritution margis for each enersy bus. total varablo cost per unit as ancther pie ulice. The velling pribe per unit is also digolayed in the center- 4. Total Labor Houra by Laber Hours per Vait - This is dosl axis tiar chart showing the total labor hours required for units produced and the direct labor hours per unit for eath encegy ber. The total labor hours are recreserted as bars and the labor hours per unit are represented as a line 5. Sales Demand vs Units Produced- This is a dutered bar thart thowing the rales demand and the ueits produced for each enersy bac. 6. Profitabiity Measures by Product - This is a chustered bar chart showing the totalreyence, total variable cost and contritation margin to each entrsv bae. Clitk here to view metel dataset What conthaioncan te made iliven tho reaulti of the analvis? result in senderutilizine direct labse hours. Producine 2.500 almand cranterry bars to meet the sales dentand wili nat achieve the maximum contribution marein markin aimand cranberry bairs Power Mountain Bars is a producer of energy bars. They currently produce three products. The tollowing information has been provided: Your goal is to determine how many units of each product should be produced to achieve the maximum total contribubion margin. Direct tabor is a cogistraifed resource ard there is only 400 direct lator houts avallable per month. You use the Solver tunction lin Excel Yoa wil present your andiysis to management. Your approach is to create a dasthboard with the following vieualizations: 1. Contribution Margie for Peatrut Butter Chocolate - Thas is a pie chart stewing the contributicn markit per unit as apiesice and the total variable cost per unit as anetiner pie slice. The willing price per unit is alse displayed in the criter. 2. Centribution Margin for Cocomit Pecan-This is aplechart showing the contritution marckin per unit as a pieslice asd the total variable cost per unit as another pie slice. The selling price cer unit is also displayed in the centec: total variable cost per unit as acother pie tike. The stlife price per unit is alse displayed in the center. 4. Total Labor Hours by Laboe Hours per Unit - This is a dual aws tar chart showine the total labor four reequired for unts teours per unit are repectsented as a line: 5. Sales Demand vi Units Produced. Tho is a chustered bar chart thowing the sales demand and the units produced for exch erierey haf contritution margis for each enersy bus. total varablo cost per unit as ancther pie ulice. The velling pribe per unit is also digolayed in the center- 4. Total Labor Houra by Laber Hours per Vait - This is dosl axis tiar chart showing the total labor hours required for units produced and the direct labor hours per unit for eath encegy ber. The total labor hours are recreserted as bars and the labor hours per unit are represented as a line 5. Sales Demand vs Units Produced- This is a dutered bar thart thowing the rales demand and the ueits produced for each enersy bac. 6. Profitabiity Measures by Product - This is a chustered bar chart showing the totalreyence, total variable cost and contritation margin to each entrsv bae. Clitk here to view metel dataset What conthaioncan te made iliven tho reaulti of the analvis? result in senderutilizine direct labse hours. Producine 2.500 almand cranterry bars to meet the sales dentand wili nat achieve the maximum contribution marein markin aimand cranberry bairs