Question
describe your analysis's purpose and result. Include a slide for the followings: 1. Cover slide with project title and team member names 2. Introduction/abstract statement
describe your analysis's purpose and result. Include a slide
for the followings:
1.
Cover slide with project title and team member names
2.
Introduction/abstract statement
3.
Source of data
4.
Intended Analysis
5.
Several slides on the actual analysis detailing Excel functions/features used to arrive at
your findings
6.
Charts to complement/summarize your findings
7.Challenges
8.Provide two to three recommendations for future actions
9.Each team member will submit the PowerPoint to the assignment link
Features of Excel to be Utilized in Your Analysis
Here is a list of what you will be introduced to in this course:
?
Formulas
?
Cell reference (relative and absolute)
?
3-D formulas
?
Date calculation
?
Multiple worksheets/workbooks
?
Statistical functions
?
Financial Functions
?
Date Functions
?
IF Statement
?
What-If Analysis
?
Goal-seeking
?
Database Functions
?
VLookUp Function
?
PivotTable
?
Solver
?
Scenario Manager
?
Charts
?
Clustered
?
Sparklines
?
Treemap
?
PivotChart
?
Trendline
Chart Style Gallery to modify chart elements
Filters
Formatting workbook (apply theme, titles, conditional formatting, etc.)
Header and Footer
Use Templat
Heres The Project, I need Answers For all above;

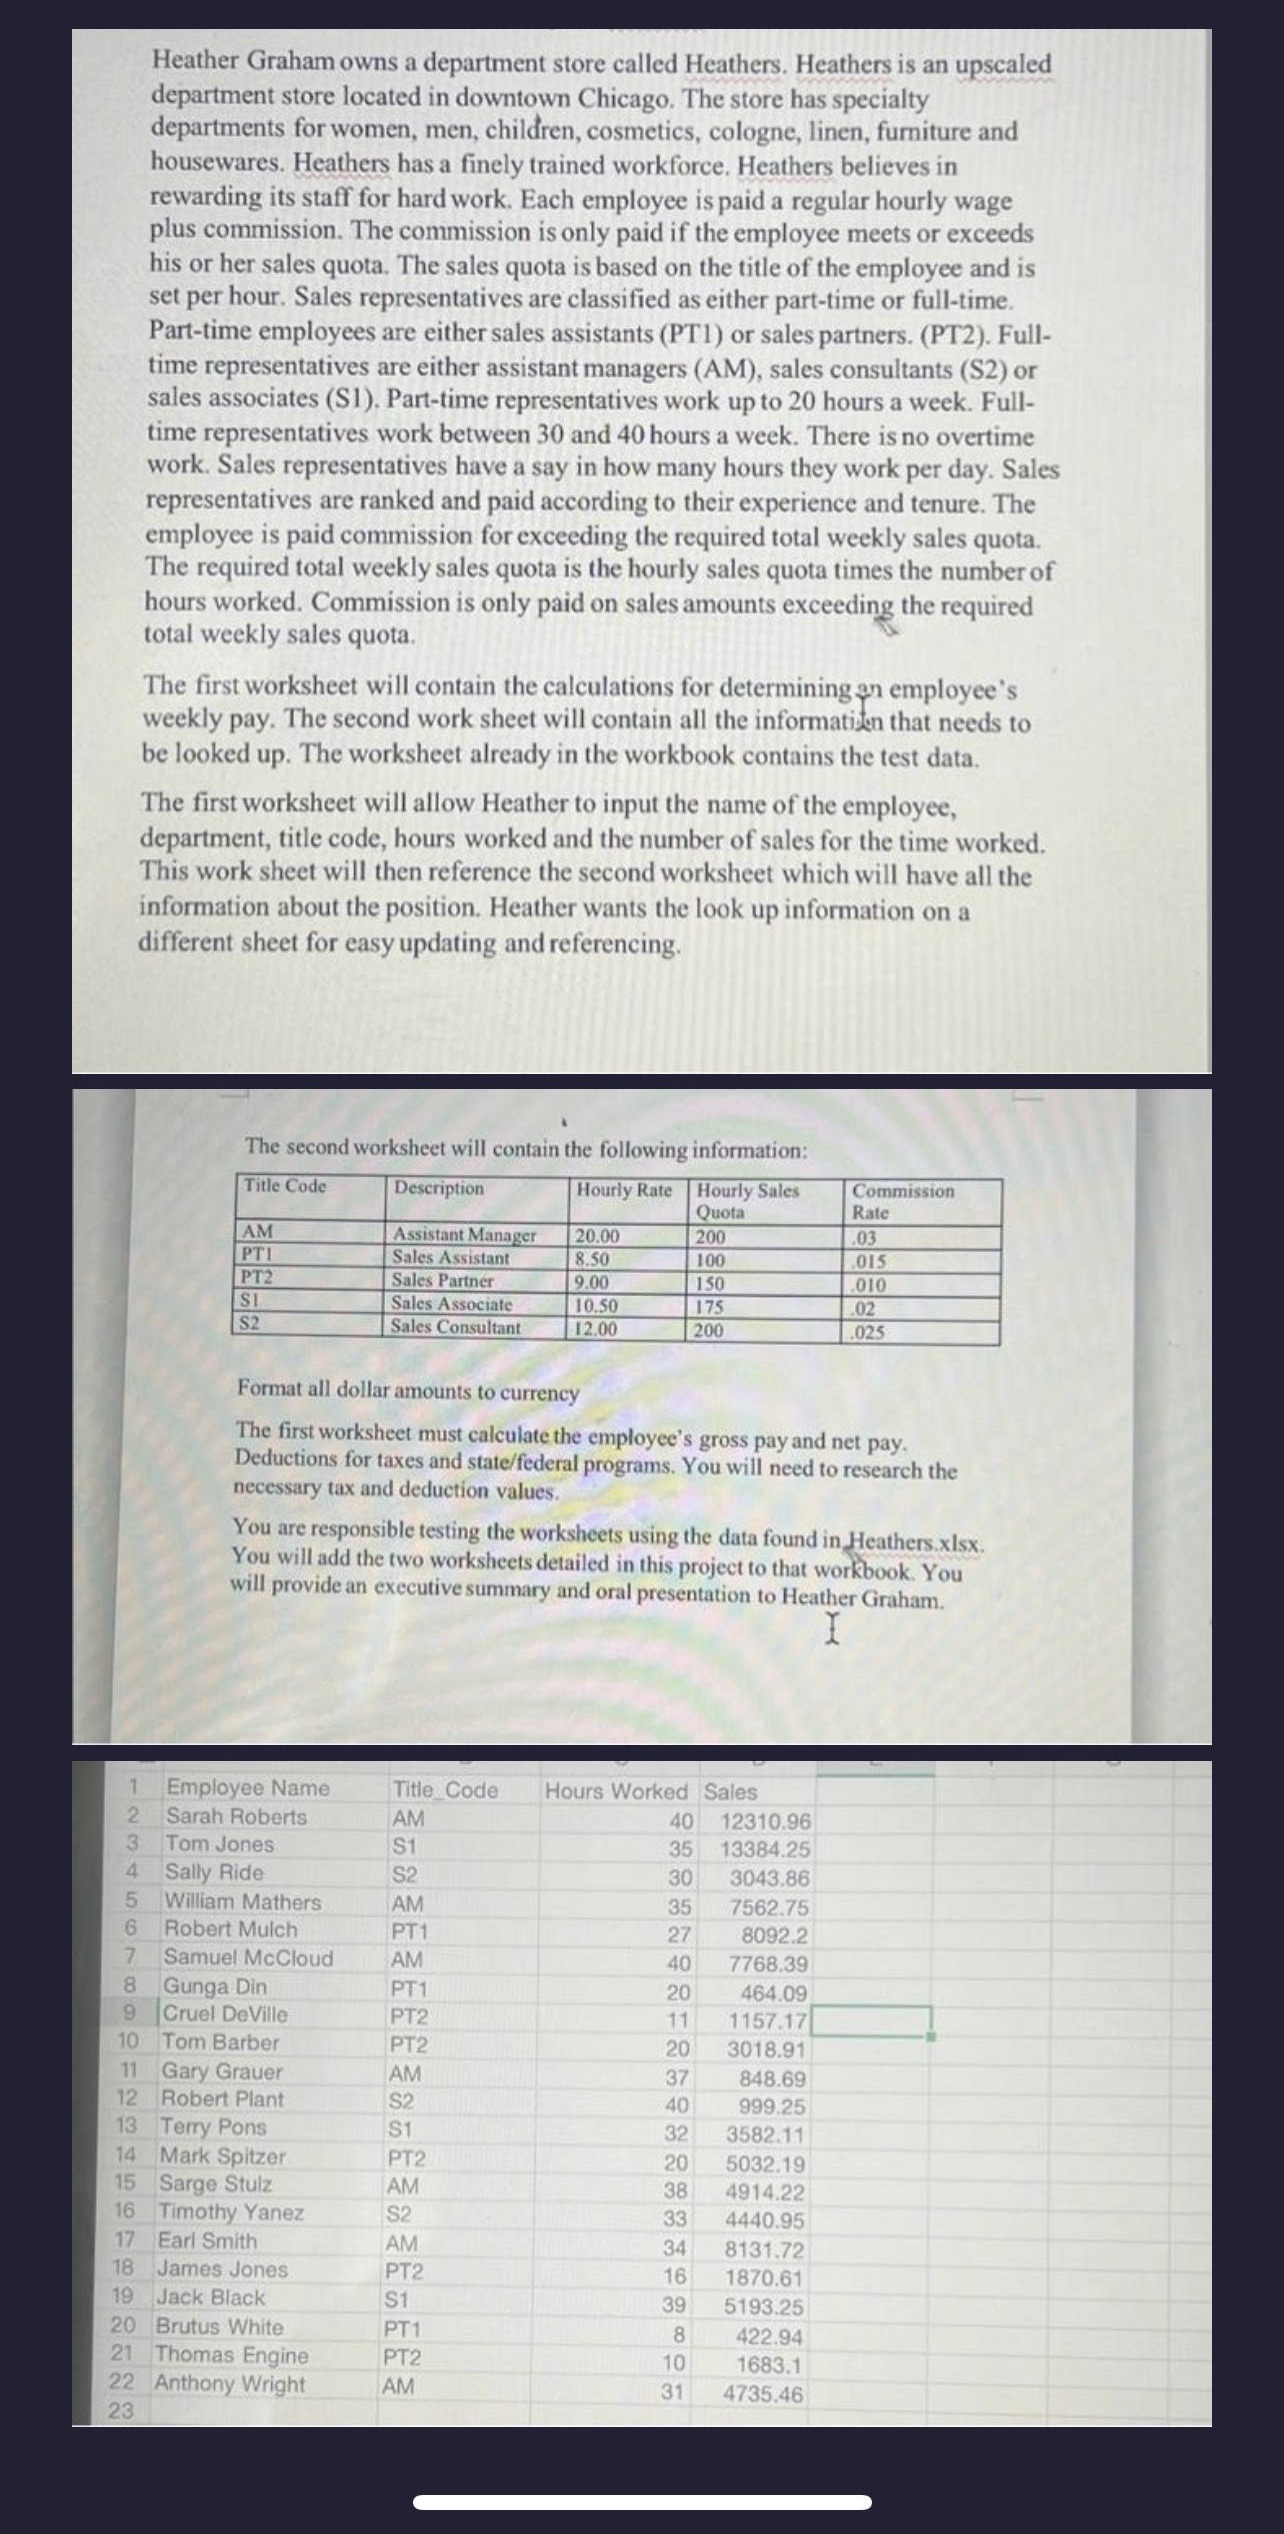
Heather Graham owns a department store called Heathers. Heathers is an upscaled department store located in downtown Chicago. The store has specialty departments for women, men, children, cosmetics, cologne, linen, furniture and housewares. Heathers has a finely trained workforce. Heathers believes in rewarding its staff for hard work. Each employee is paid a regular hourly wage plus commission. The commission is only paid if the employee meets or exceeds his or her sales quota. The sales quota is based on the title of the employee and is set per hour. Sales representatives are classified as either part-time or full-time. Part-time employees are either sales assistants (PT1) or sales partners. (PT2). Full- time representatives are either assistant managers (AM), sales consultants (S2) or sales associates (S1). Part-time representatives work up to 20 hours a week. Full- time representatives work between 30 and 40 hours a week. There is no overtime work. Sales representatives have a say in how many hours they work per day. Sales representatives are ranked and paid according to their experience and tenure. The employee is paid commission for exceeding the required total weekly sales quota. The required total weekly sales quota is the hourly sales quota times the number of hours worked. Commission is only paid on sales amounts exceeding the required total weekly sales quota. 34563 The first worksheet will contain the calculations for determining an employee's weekly pay. The second work sheet will contain all the information that needs to be looked up. The worksheet already in the workbook contains the test data. The first worksheet will allow Heather to input the name of the employee, department, title code, hours worked and the number of sales for the time worked. This work sheet will then reference the second worksheet which will have all the information about the position. Heather wants the look up information on a different sheet for easy updating and referencing. The second worksheet will contain the following information: Title Code Hourly Rate Hourly Sales Quota AM PTI PT2 SI S2 1 Employee Name Sarah Roberts 2 Tom Jones 4 Sally Ride William Mathers Robert Mulch Samuel McCloud 7 8 Gunga Din 9 Cruel DeVille 10 Tom Barber 11 Gary Grauer 12 Robert Plant 13 Terry Pons 14 Mark Spitzer 15 Sarge Stulz Description Assistant Manager Sales Assistant Sales Partner Sales Associate Sales Consultant Format all dollar amounts to currency The first worksheet must calculate the employee's gross pay and net pay. Deductions for taxes and state/federal programs. You will need to research the necessary tax and deduction values. 16 Timothy Yanez 17 Earl Smith 18 James Jones 19 Jack Black You are responsible testing the worksheets using the data found in Heathers.xlsx. You will add the two worksheets detailed in this project to that workbook. You will provide an executive summary and oral presentation to Heather Graham. 20 Brutus White 21 Thomas Engine 22 Anthony Wright 23 Title Code AM $1 S2 AM PT1 AM PT1 PT2 PT2 20.00 8.50 9.00 10.50 12.00 AM S2 $1 PT2 AM S2 AM PT2 S1 PT1 PT2 AM 200 100 150 175 200 Hours Worked Sales 40 12310.96 35 13384.25 30 3043.86 35 7562.75 27 8092.2 40 7768.39 20 464.09 11 1157.17 20 3018.91 37 40 32 20 38 33 848.69 999.25 3582.11 5032.19 4914.22 4440.95 8131.72 1870.61 39 5193.25 34 16 8 10 31 Commission Rate 03 015 010 422.94 1683.1 4735.46 .02 025
Step by Step Solution
There are 3 Steps involved in it
Step: 1

Get Instant Access to Expert-Tailored Solutions
See step-by-step solutions with expert insights and AI powered tools for academic success
Step: 2

Step: 3

Ace Your Homework with AI
Get the answers you need in no time with our AI-driven, step-by-step assistance
Get Started


