Answered step by step
Verified Expert Solution
Question
1 Approved Answer
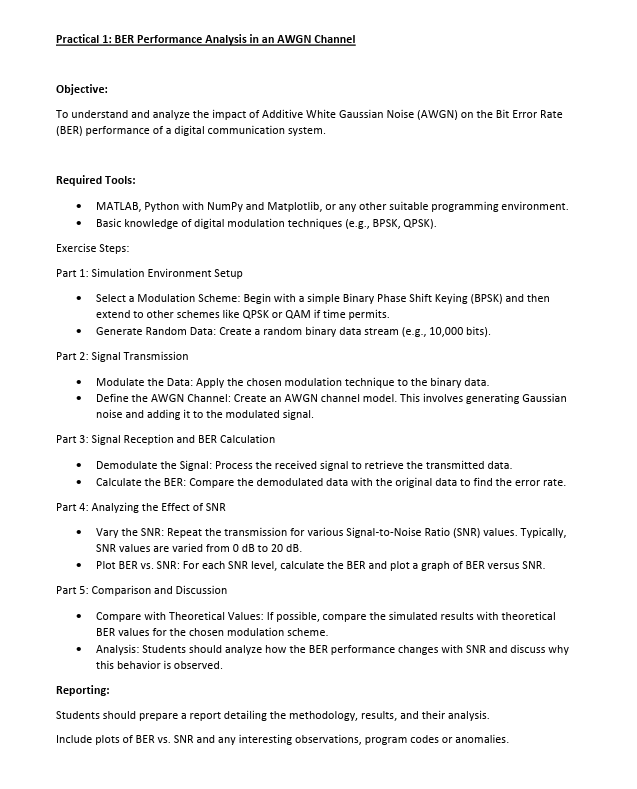
Practical 1: BER Performance Analysis in an AWGN Channel Objective: To understand and analyze the impact of Additive White Gaussian Noise (AWGN) on the Bit
 Practical 1: BER Performance Analysis in an AWGN Channel Objective: To understand and analyze the impact of Additive White Gaussian Noise (AWGN) on the Bit Error Rate (BER) performance of a digital communication system. Required Tools: - MATLAB, Python with NumPy and Matplotlib, or any other suitable programming environment. - Basic knowledge of digital modulation techniques (e.g., BPSK, QPSK). Exercise Steps: Part 1: Simulation Environment Setup - Select a Modulation Scheme: Begin with a simple Binary Phase Shift Keying (BPSK) and then extend to other schemes like QPSK or QAM if time permits. - Generate Random Data: Create a random binary data stream (e.g., 10,000 bits). Part 2: Signal Transmission - Modulate the Data: Apply the chosen modulation technique to the binary data. - Define the AWGN Channel: Create an AWGN channel model. This involves generating Gaussian noise and adding it to the modulated signal. Part 3: Signal Reception and BER Calculation - Demodulate the Signal: Process the received signal to retrieve the transmitted data. - Calculate the BER: Compare the demodulated data with the original data to find the error rate. Part 4: Analyzing the Effect of SNR - Vary the SNR: Repeat the transmission for various Signal-to-Noise Ratio (SNR) values. Typically, SNR values are varied from 0dB to 20dB. - Plot BER vs. SNR: For each SNR level, calculate the BER and plot a graph of BER versus SNR. Part 5: Comparison and Discussion - Compare with Theoretical Values: If possible, compare the simulated results with theoretical BER values for the chosen modulation scheme. - Analysis: Students should analyze how the BER performance changes with SNR and discuss why this behavior is observed. Reporting: Students should prepare a report detailing the methodology, results, and their analysis. Include plots of BER vs. SNR and any interesting observations, program codes or anomalies
 Step by Step Solution
There are 3 Steps involved in it
Step: 1

Get Instant Access to Expert-Tailored Solutions
See step-by-step solutions with expert insights and AI powered tools for academic success
Step: 2

Step: 3

Ace Your Homework with AI
Get the answers you need in no time with our AI-driven, step-by-step assistance
Get Started


