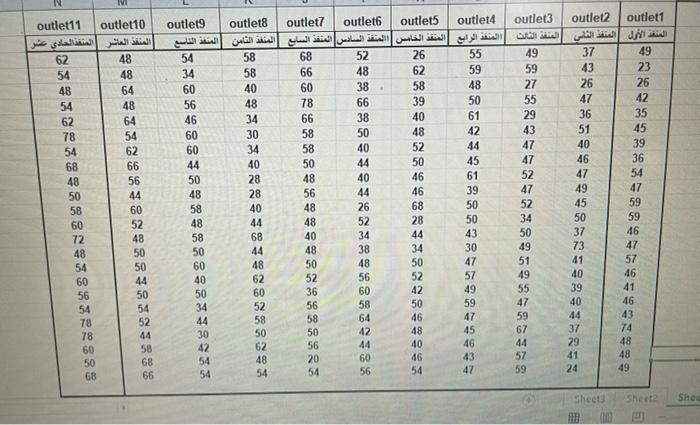
Practical Exercise #12 The following table shows the ages of 253 observers, distributed within eleven outlets, that are required: First : Choosing a random sample using a 24-observers toolkit in Microsoft Excel Second: Choose a regular sample using a Microsoft Excel toolkit with a withdrawal range of 10 employees Third : Draw the Histograms for both samples Fourth: Represent the results of the two samples graphically using a straight line and graphical columns Fifth : Calculate measures of central tendency for the ages of the two samples and measures of dispersion, and between which is better Sixth: Test the severity of the relationship between the two samples Seventh: Assuming that one of the two samples represents the dependent variable.. and the second represents the independent variablethe extent of the constant regression and the age of the employee in the first sample if the age of the employee in the second sample is 55 years. outlet outlet8 outlet11 outlet10 outlet7 outlet outlet5 outlet4 outlet3 outlet2 outlet1 | 49 26 42 35 45 62 78 54 26 62 58 39 40 48 52 50 46 46 68 28 66 58 58 50 48 56 48 37 43 26 47 36 51 40 46 47 49 45 50 62 60 55 29 43 47 47 52 47 50 61 42 44 45 61 39 50 50 43 30 47 44 40 50 Sheat sheet. She Practical Exercise #12 The following table shows the ages of 253 observers, distributed within eleven outlets, that are required: First : Choosing a random sample using a 24-observers toolkit in Microsoft Excel Second: Choose a regular sample using a Microsoft Excel toolkit with a withdrawal range of 10 employees Third : Draw the Histograms for both samples Fourth: Represent the results of the two samples graphically using a straight line and graphical columns Fifth : Calculate measures of central tendency for the ages of the two samples and measures of dispersion, and between which is better Sixth: Test the severity of the relationship between the two samples Seventh: Assuming that one of the two samples represents the dependent variable.. and the second represents the independent variablethe extent of the constant regression and the age of the employee in the first sample if the age of the employee in the second sample is 55 years. outlet outlet8 outlet11 outlet10 outlet7 outlet outlet5 outlet4 outlet3 outlet2 outlet1 | 49 26 42 35 45 62 78 54 26 62 58 39 40 48 52 50 46 46 68 28 66 58 58 50 48 56 48 37 43 26 47 36 51 40 46 47 49 45 50 62 60 55 29 43 47 47 52 47 50 61 42 44 45 61 39 50 50 43 30 47 44 40 50 Sheat sheet. She


