

Answered step by step
Verified Expert Solution
Question
1 Approved Answer
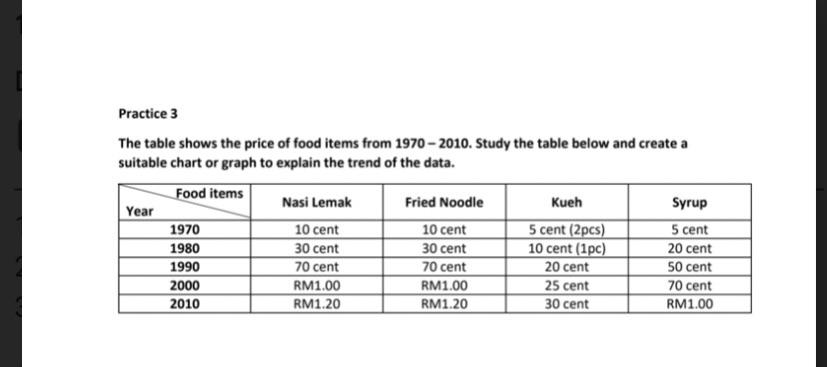
Practice 3 The table shows the price of food items from 1970 - 2010. Study the table below and create a suitable chart or graph
Step by Step Solution
There are 3 Steps involved in it
Step: 1

Get Instant Access to Expert-Tailored Solutions
See step-by-step solutions with expert insights and AI powered tools for academic success
Step: 2

Step: 3
Ace Your Homework with AI
Get the answers you need in no time with our AI-driven, step-by-step assistance
Get Started
Macroeconomics Principles And Policy
Authors: William J. Baumol, Alan S. Blinder
11th Edition
0324586213, 978-0324586213