Answered step by step
Verified Expert Solution
Link Copied!

Question

1 Approved Answer

Practice question only - DO NOT REPORT Before answering the question please refer to these 3 examples here - https://drive.google.com/file/d/1h91zzSheD7Rbi-0tch8siTUaS7Jaa-uh/view?usp=sharing https://drive.google.com/file/d/1pplCUdig979abFDhLdmJYcw8T_4saEzB/view?usp=sharing https://drive.google.com/file/d/1L5ZFKQcAG3uu1C5GcfwZ6Sjs3AXhSpQo/view?usp=sharing Question: Conduct a

Practice question only - DO NOT REPORT

Before answering the question please refer to these 3 examples here -

https://drive.google.com/file/d/1h91zzSheD7Rbi-0tch8siTUaS7Jaa-uh/view?usp=sharing

https://drive.google.com/file/d/1pplCUdig979abFDhLdmJYcw8T_4saEzB/view?usp=sharing

https://drive.google.com/file/d/1L5ZFKQcAG3uu1C5GcfwZ6Sjs3AXhSpQo/view?usp=sharing

Question: Conduct a chi square test on the relationship between gender and "ever received a traffic ticket".This data comes from the General Social Survey (gss.norc.org).Make sure to state your hypothesis, set up a sampling distribution, interpret and report your results, and conduct post-hoc test(s) if applicable.

?
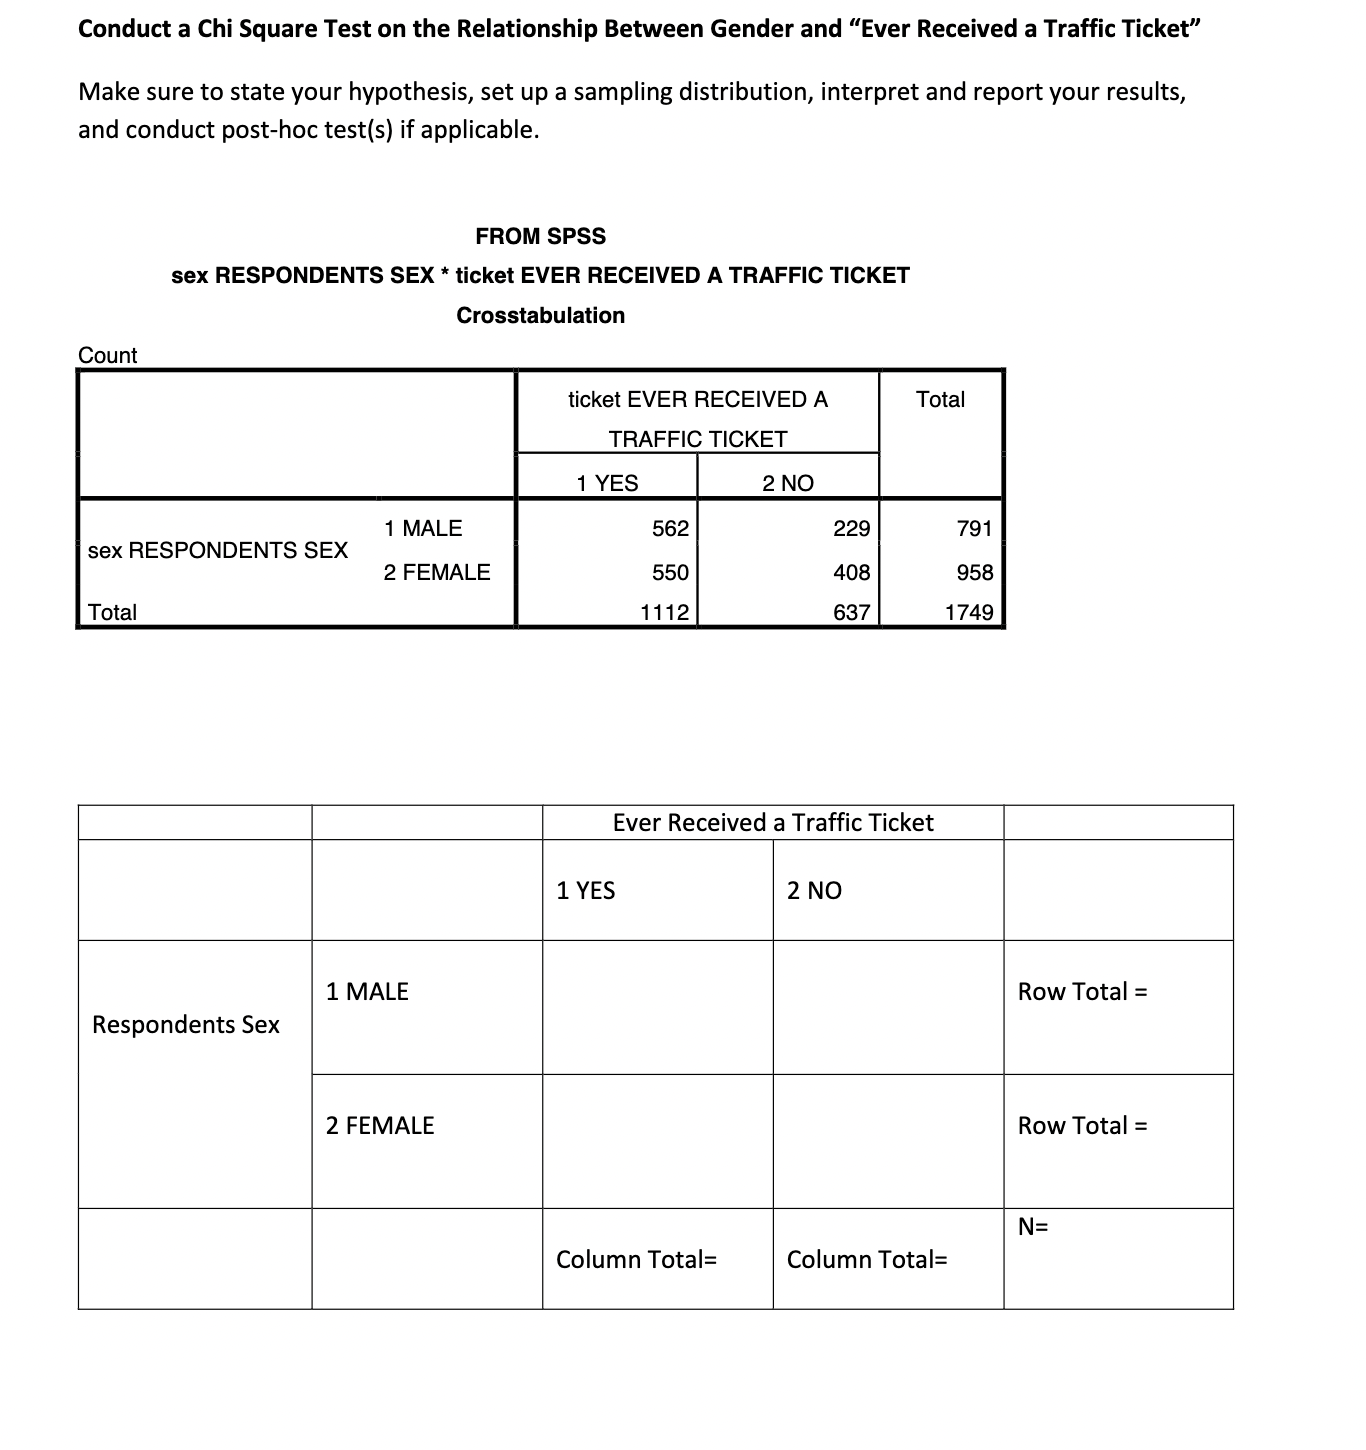
image text in transcribedimage text in transcribedimage text in transcribed
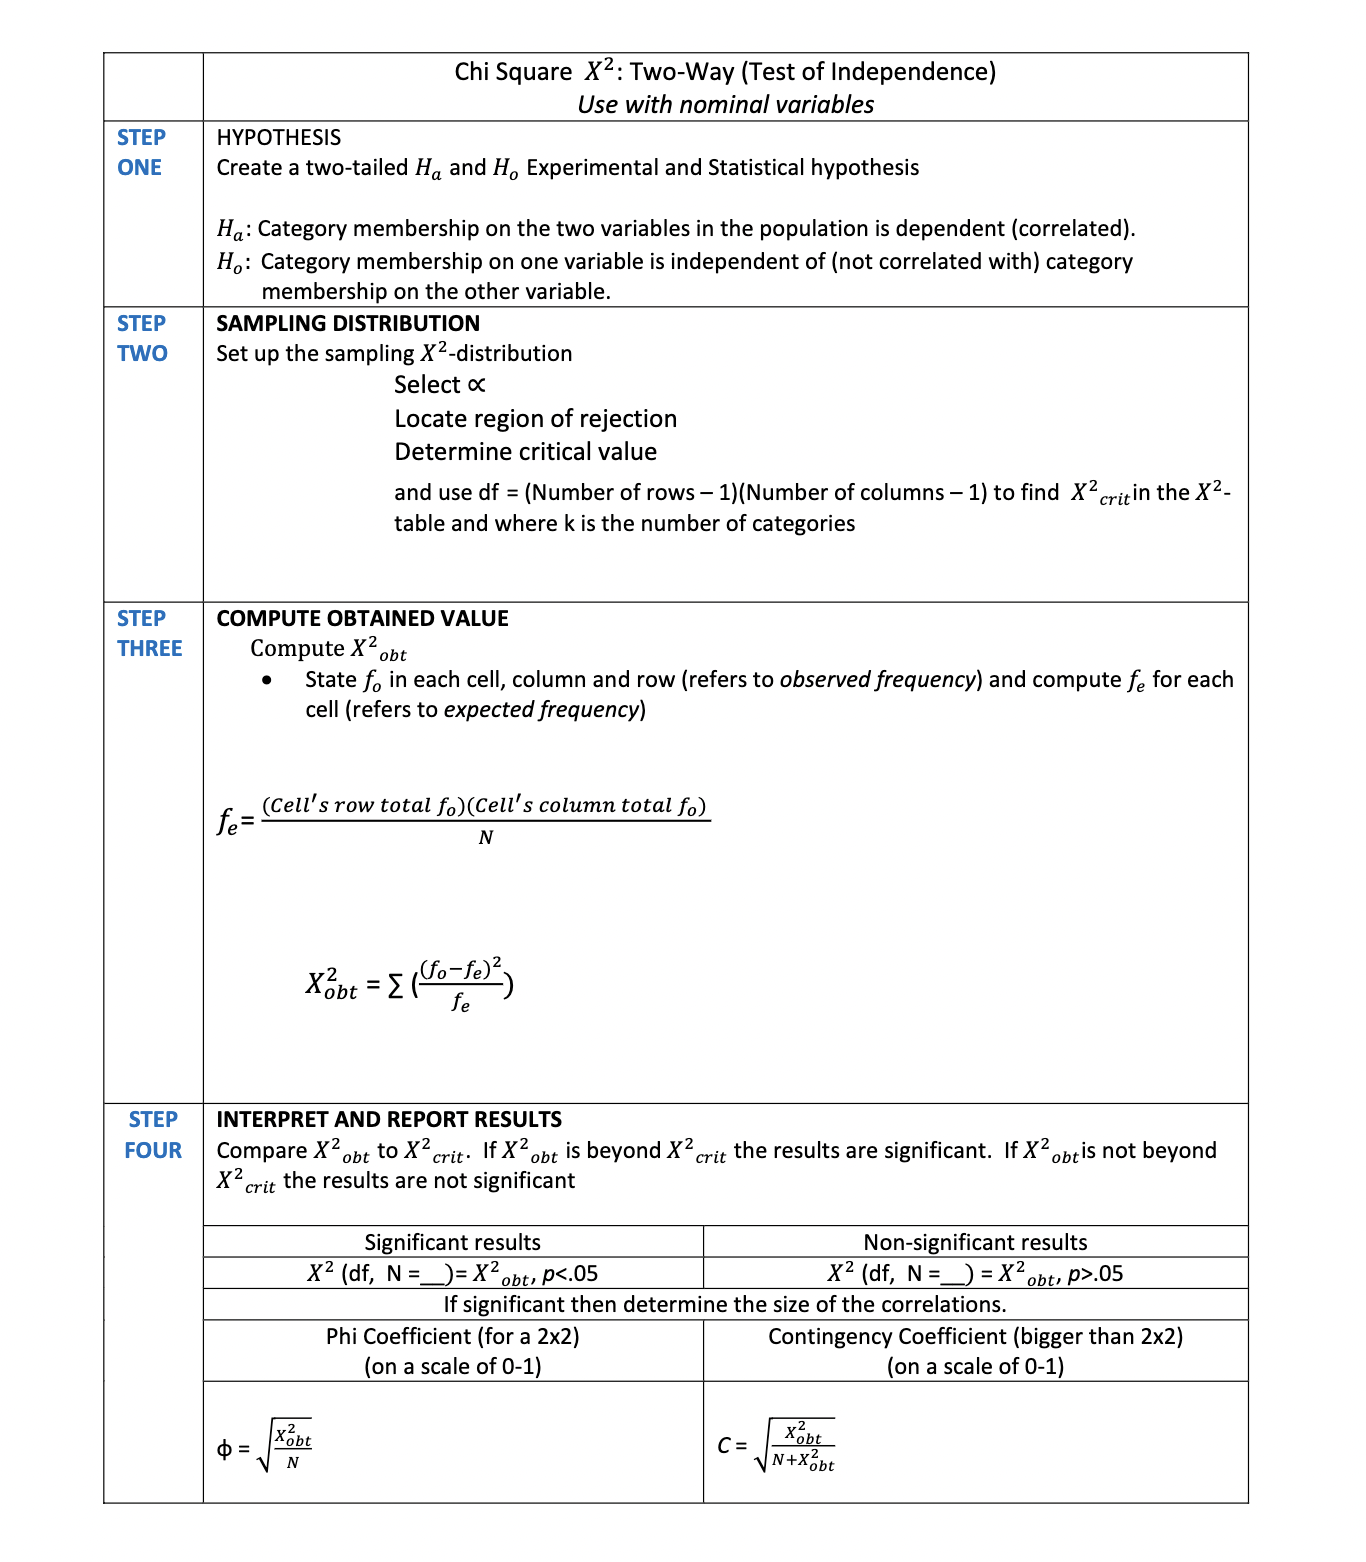
Conduct a Chi Square Test on the Relationship Between Gender and "Ever Received a Traffic Ticket\" Make sure to state your hypothesis, set up a sampling distribution, interpret and report your results, and conduct posthoe te5t(s) if applicable. FROM SPSS sex RESPONDENTS SEX * ticket EVER RECEIVED A TRAFFIC TICKET Crosstabulation Count ticket EVER RECEIVED A Total TRAFFIC TICKET 1 Yes I!- 1 MALE 562 229 791 sex RESPONDENTS SEX 2 FEMALE 550 408 958 Total 1 1 12 637 1749 Ever Received a Traffic Ticket 1 YES 2 N0 Row Total = Respondents Sex 2 FEMALE Row Total = Column Total: Column Total: STATE HYPOTHESIS SET UP SAMPLING DISTRIBUTION INTERPRET AND REPORT RESULTS CONDUCT AND INTERPRET POST HOC TEST(S) (IF APPLICABLE} Chi Square X2: Two-Way (Test of Independence) Use with nominal variables STEP HYPOTHESIS ONE Create a two-tailed Ha and Ho Experimental and Statistical hypothesis Ha: Category membership on the two variables in the population is dependent (correlated). Ho: Category membership on one variable is independent of (not correlated with) category membership on the other variable. STEP SAMPLING DISTRIBUTION TWO Set up the sampling X2-distribution Select x Locate region of rejection Determine critical value and use df = (Number of rows - 1)(Number of columns - 1) to find X2critin the X2- table and where k is the number of categories STEP COMPUTE OBTAINED VALUE THREE Compute X obt State fo in each cell, column and row (refers to observed frequency) and compute fe for each cell (refers to expected frequency) fe= (Cell's row total fo) (Cell's column total fo) N Xobt = [( Go - fe )2 , fe STEP INTERPRET AND REPORT RESULTS FOUR Compare X2 obt to X2crit. If X"obt is beyond X crit the results are significant. If X obtis not beyond X crit the results are not significant Significant results Non-significant results x2 (df, N =_)= X'obt, P<.05 x2 n="_)" x p>.05 If significant then determine the size of the correlations. Phi Coefficient (for a 2x2) Contingency Coefficient (bigger than 2x2) on a scale of 0-1) (on a scale of 0-1 Xobt C= Xobt N VN+Xobt

Step by Step Solution

There are 3 Steps involved in it

Step: 1

blur-text-image

Get Instant Access to Expert-Tailored Solutions

See step-by-step solutions with expert insights and AI powered tools for academic success

Step: 2

blur-text-image

Step: 3

blur-text-image

Ace Your Homework with AI

Get the answers you need in no time with our AI-driven, step-by-step assistance

Get Started

Recommended Textbook for

Advanced Calculus

Authors: R Creighton Buck

3rd Edition

147861613X, 9781478616139

More Books

Students also viewed these Mathematics questions