Answered step by step
Verified Expert Solution
Question
1 Approved Answer
Predecessors Duration Activity 1 2 3 . 14 4 3 7 5 4 14 7 6 S 7 14 6 7 8 5 8 -
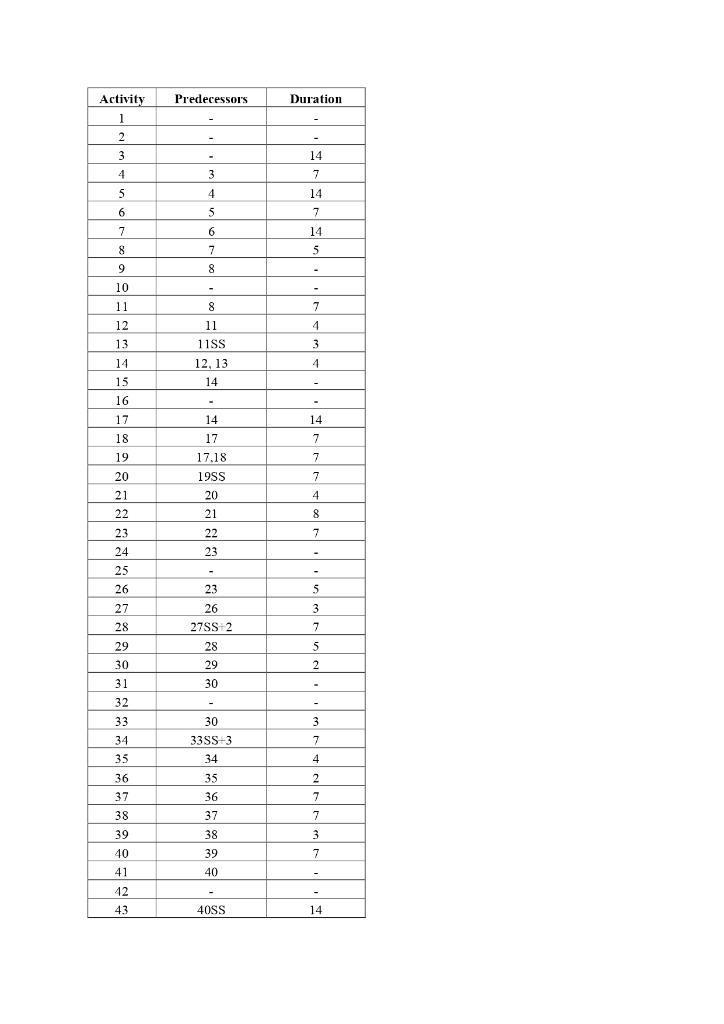
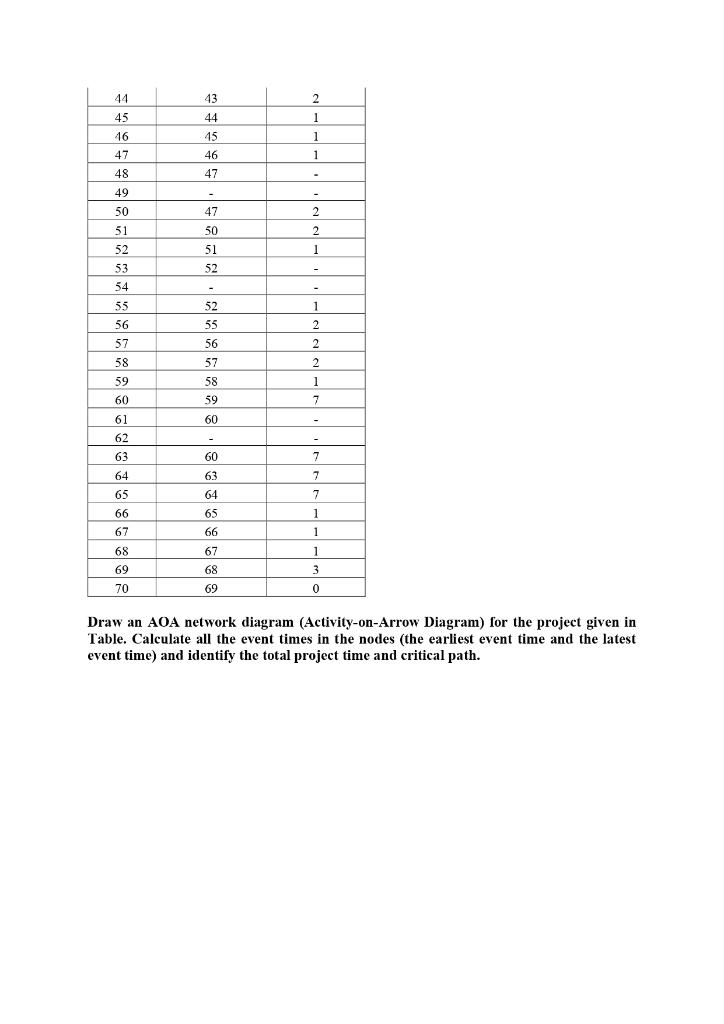
Predecessors Duration Activity 1 2 3 . 14 4 3 7 5 4 14 7 6 S 7 14 6 7 8 5 8 - 9 10 11 7 4 12 - 8 11 11SS 12,13 14 13 3 4 14 15 - 16 - 14 14 17 18 19 17 7 7 7 7 20 17.18 1955 20 21 4 8 21 22 23 24 25 7 22 23 - 26 S 3 27 28 23 26 27SS-2 28 29 7 29 5 2 30 31 30 - 32 - 33 3 34 35 30 33SS-3 34 7 4 36 35 37 36 37 38 39 2 7 7 3 7 38 39 40 41 40 - 42 43 40SS 14 44 43 45 2 1 1 44 45 46 46 47 48 1 47 - - 49 50 47 2 51 50 2 1 52 53 51 52 - 54 - - 55 1 52 55 56 2 57 56 2 2 57 58 59 58 59 1 7 60 60 - 61 62 63 60 7 64 63 7 64 7 65 66 65 66 1 1 1 67 67 1 68 69 68 69 3 0 70 Draw an AOA network diagram (Activity-on-Arrow Diagram) for the project given in Table. Calculate all the event times in the nodes (the earliest event time and the latest event time) and identify the total project time and critical path
Step by Step Solution
There are 3 Steps involved in it
Step: 1
Get Instant Access to Expert-Tailored Solutions
See step-by-step solutions with expert insights and AI powered tools for academic success
Step: 2
Step: 3
Ace Your Homework with AI
Get the answers you need in no time with our AI-driven, step-by-step assistance
Get Started