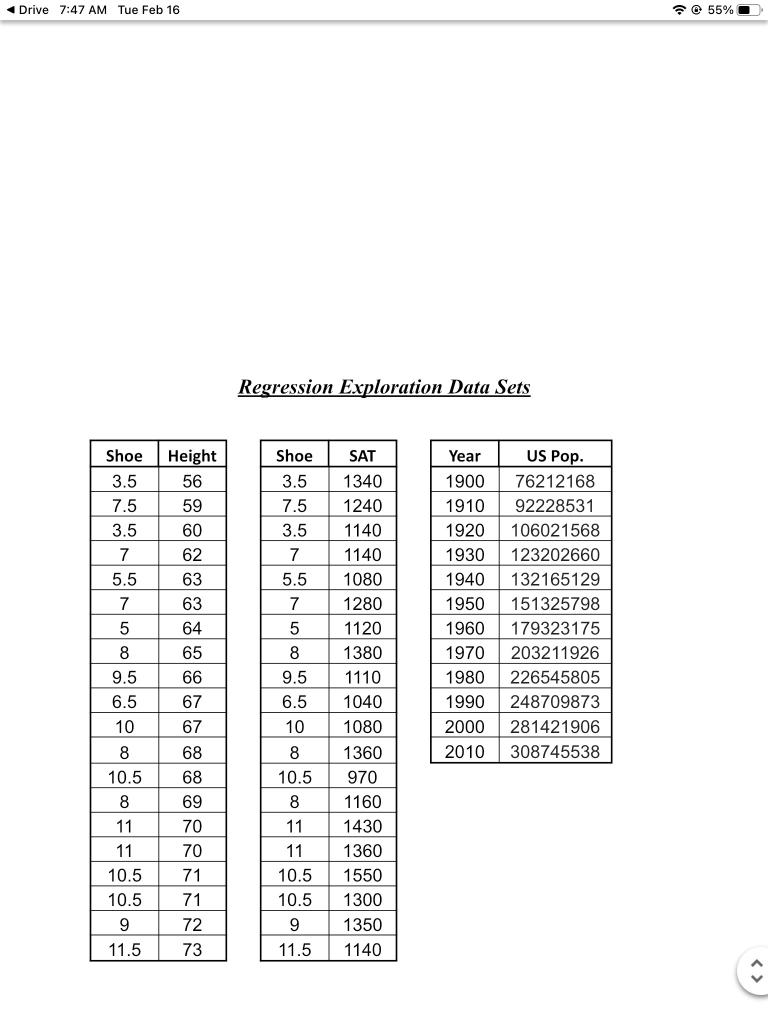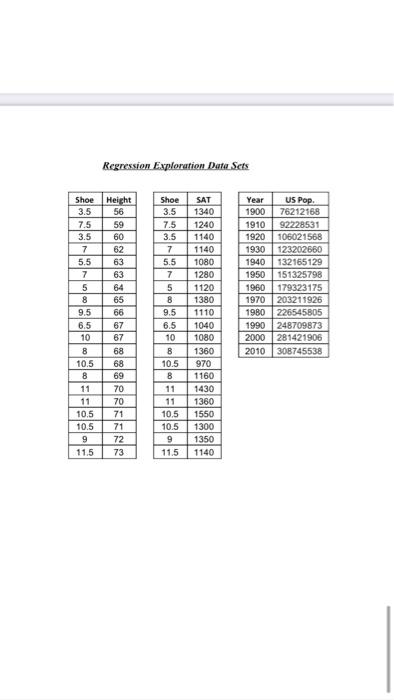


predicted height (show how you got answert Shoe size vs. SAT score LSRL: slope interpretation yIntercept interpretation predicted SAT score (show how you got answert): Time vs. US Population SRL: Hope interpretation: oy intercept interpretation predicted US population (show how you got answer!) 5) Calculate your residuals with only the height and SAT predictions from above. Using your calculator, create residual plots for all three sets of data and roughly sketch them on the grids provided below. Comment whether you believe the data would be best represented by a lincar model, and explain your reasoning using the residual plots. Height residuale SAT score residual 7:42 AM Tue Feb 16 C 60% chegg.com predicted height show how you got answert): Shoe size vs SAT score LSRL: slope interpretation y-intercept interpretation: predicted SAT score show how you got answert); Time vs US Population LSRL slope interpretation: oy intercept interpretation predicted US population show how you got answer) 5) Calculate your residuals with only the height and SAT predictions from above. Using your calculator, create residual plots for all three sets of data and roughly sketch them on the grids provided below. Comment whether you believe the data would be best represented by a linear model, and explain your reasoning using the residual plots Height residual SAT score residual Drive 7:47 AM Tue Feb 16 55% Regression Exploration Data Sets Year Shoe 3.5 7.5 3.5 Shoe 3.5 7.5 3.5 7 5.5 7 5 7 Height 56 59 60 62 63 63 64 65 66 67 67 1900 1910 1920 1930 1940 1950 1960 1970 1980 5.5 7 5 8 9.5 6.5 10 8 US Pop. 76212168 92228531 106021568 123202660 132165129 151325798 179323175 203211926 226545805 248709873 281421906 308745538 9.5 SAT 1340 1240 1140 1140 1080 1280 1120 1380 1110 1040 1080 1360 970 1160 1430 1360 1550 1300 1350 1140 6.5 1990 10 2000 2010 8 10.5 8 10.5 8 11 68 68 69 70 70 71 71 72 73 10.5 10.5 11 10.5 10.5 9 11.5 Regression Exploration Data Sets Shoe 3.5 7.5 3.5 7 5.5 7 5 . Shoe 3.5 7.5 3.5 7 5.5 7 5 8 9.5 6.5 10 8 10.5 8 11 11 10.5 10.5 9 11.5 8 Height 56 59 60 62 63 63 64 65 66 67 67 68 68 69 70 70 71 71 72 73 Year US Pop. 1900 76212168 1910 92228531 1920 106021568 1930 123202660 1940 132165129 1950 151325798 1960 179323175 1970 203211926 1980 226545805 1990 248709873 2000 281421906 2010 308745538 SAT 1340 1240 1140 1140 1080 1280 1120 1380 1110 1040 1080 1360 970 1160 1430 1360 1550 1300 1350 1140 9.5 6.5 A. - 10.5 8 11 11 10.5 10.5 9 11.5 predicted height (show how you got answert Shoe size vs. SAT score LSRL: slope interpretation yIntercept interpretation predicted SAT score (show how you got answert): Time vs. US Population SRL: Hope interpretation: oy intercept interpretation predicted US population (show how you got answer!) 5) Calculate your residuals with only the height and SAT predictions from above. Using your calculator, create residual plots for all three sets of data and roughly sketch them on the grids provided below. Comment whether you believe the data would be best represented by a lincar model, and explain your reasoning using the residual plots. Height residuale SAT score residual 7:42 AM Tue Feb 16 C 60% chegg.com predicted height show how you got answert): Shoe size vs SAT score LSRL: slope interpretation y-intercept interpretation: predicted SAT score show how you got answert); Time vs US Population LSRL slope interpretation: oy intercept interpretation predicted US population show how you got answer) 5) Calculate your residuals with only the height and SAT predictions from above. Using your calculator, create residual plots for all three sets of data and roughly sketch them on the grids provided below. Comment whether you believe the data would be best represented by a linear model, and explain your reasoning using the residual plots Height residual SAT score residual Drive 7:47 AM Tue Feb 16 55% Regression Exploration Data Sets Year Shoe 3.5 7.5 3.5 Shoe 3.5 7.5 3.5 7 5.5 7 5 7 Height 56 59 60 62 63 63 64 65 66 67 67 1900 1910 1920 1930 1940 1950 1960 1970 1980 5.5 7 5 8 9.5 6.5 10 8 US Pop. 76212168 92228531 106021568 123202660 132165129 151325798 179323175 203211926 226545805 248709873 281421906 308745538 9.5 SAT 1340 1240 1140 1140 1080 1280 1120 1380 1110 1040 1080 1360 970 1160 1430 1360 1550 1300 1350 1140 6.5 1990 10 2000 2010 8 10.5 8 10.5 8 11 68 68 69 70 70 71 71 72 73 10.5 10.5 11 10.5 10.5 9 11.5 Regression Exploration Data Sets Shoe 3.5 7.5 3.5 7 5.5 7 5 . Shoe 3.5 7.5 3.5 7 5.5 7 5 8 9.5 6.5 10 8 10.5 8 11 11 10.5 10.5 9 11.5 8 Height 56 59 60 62 63 63 64 65 66 67 67 68 68 69 70 70 71 71 72 73 Year US Pop. 1900 76212168 1910 92228531 1920 106021568 1930 123202660 1940 132165129 1950 151325798 1960 179323175 1970 203211926 1980 226545805 1990 248709873 2000 281421906 2010 308745538 SAT 1340 1240 1140 1140 1080 1280 1120 1380 1110 1040 1080 1360 970 1160 1430 1360 1550 1300 1350 1140 9.5 6.5 A. - 10.5 8 11 11 10.5 10.5 9 11.5


