Answered step by step
Verified Expert Solution
Link Copied!

Question

1 Approved Answer

Predictions from the least-squares regression line o REGRESSION AND CORRELATION Predictions from the least-squares regression line V With the aim of predicting the selling price

Predictions from the least-squares regression line
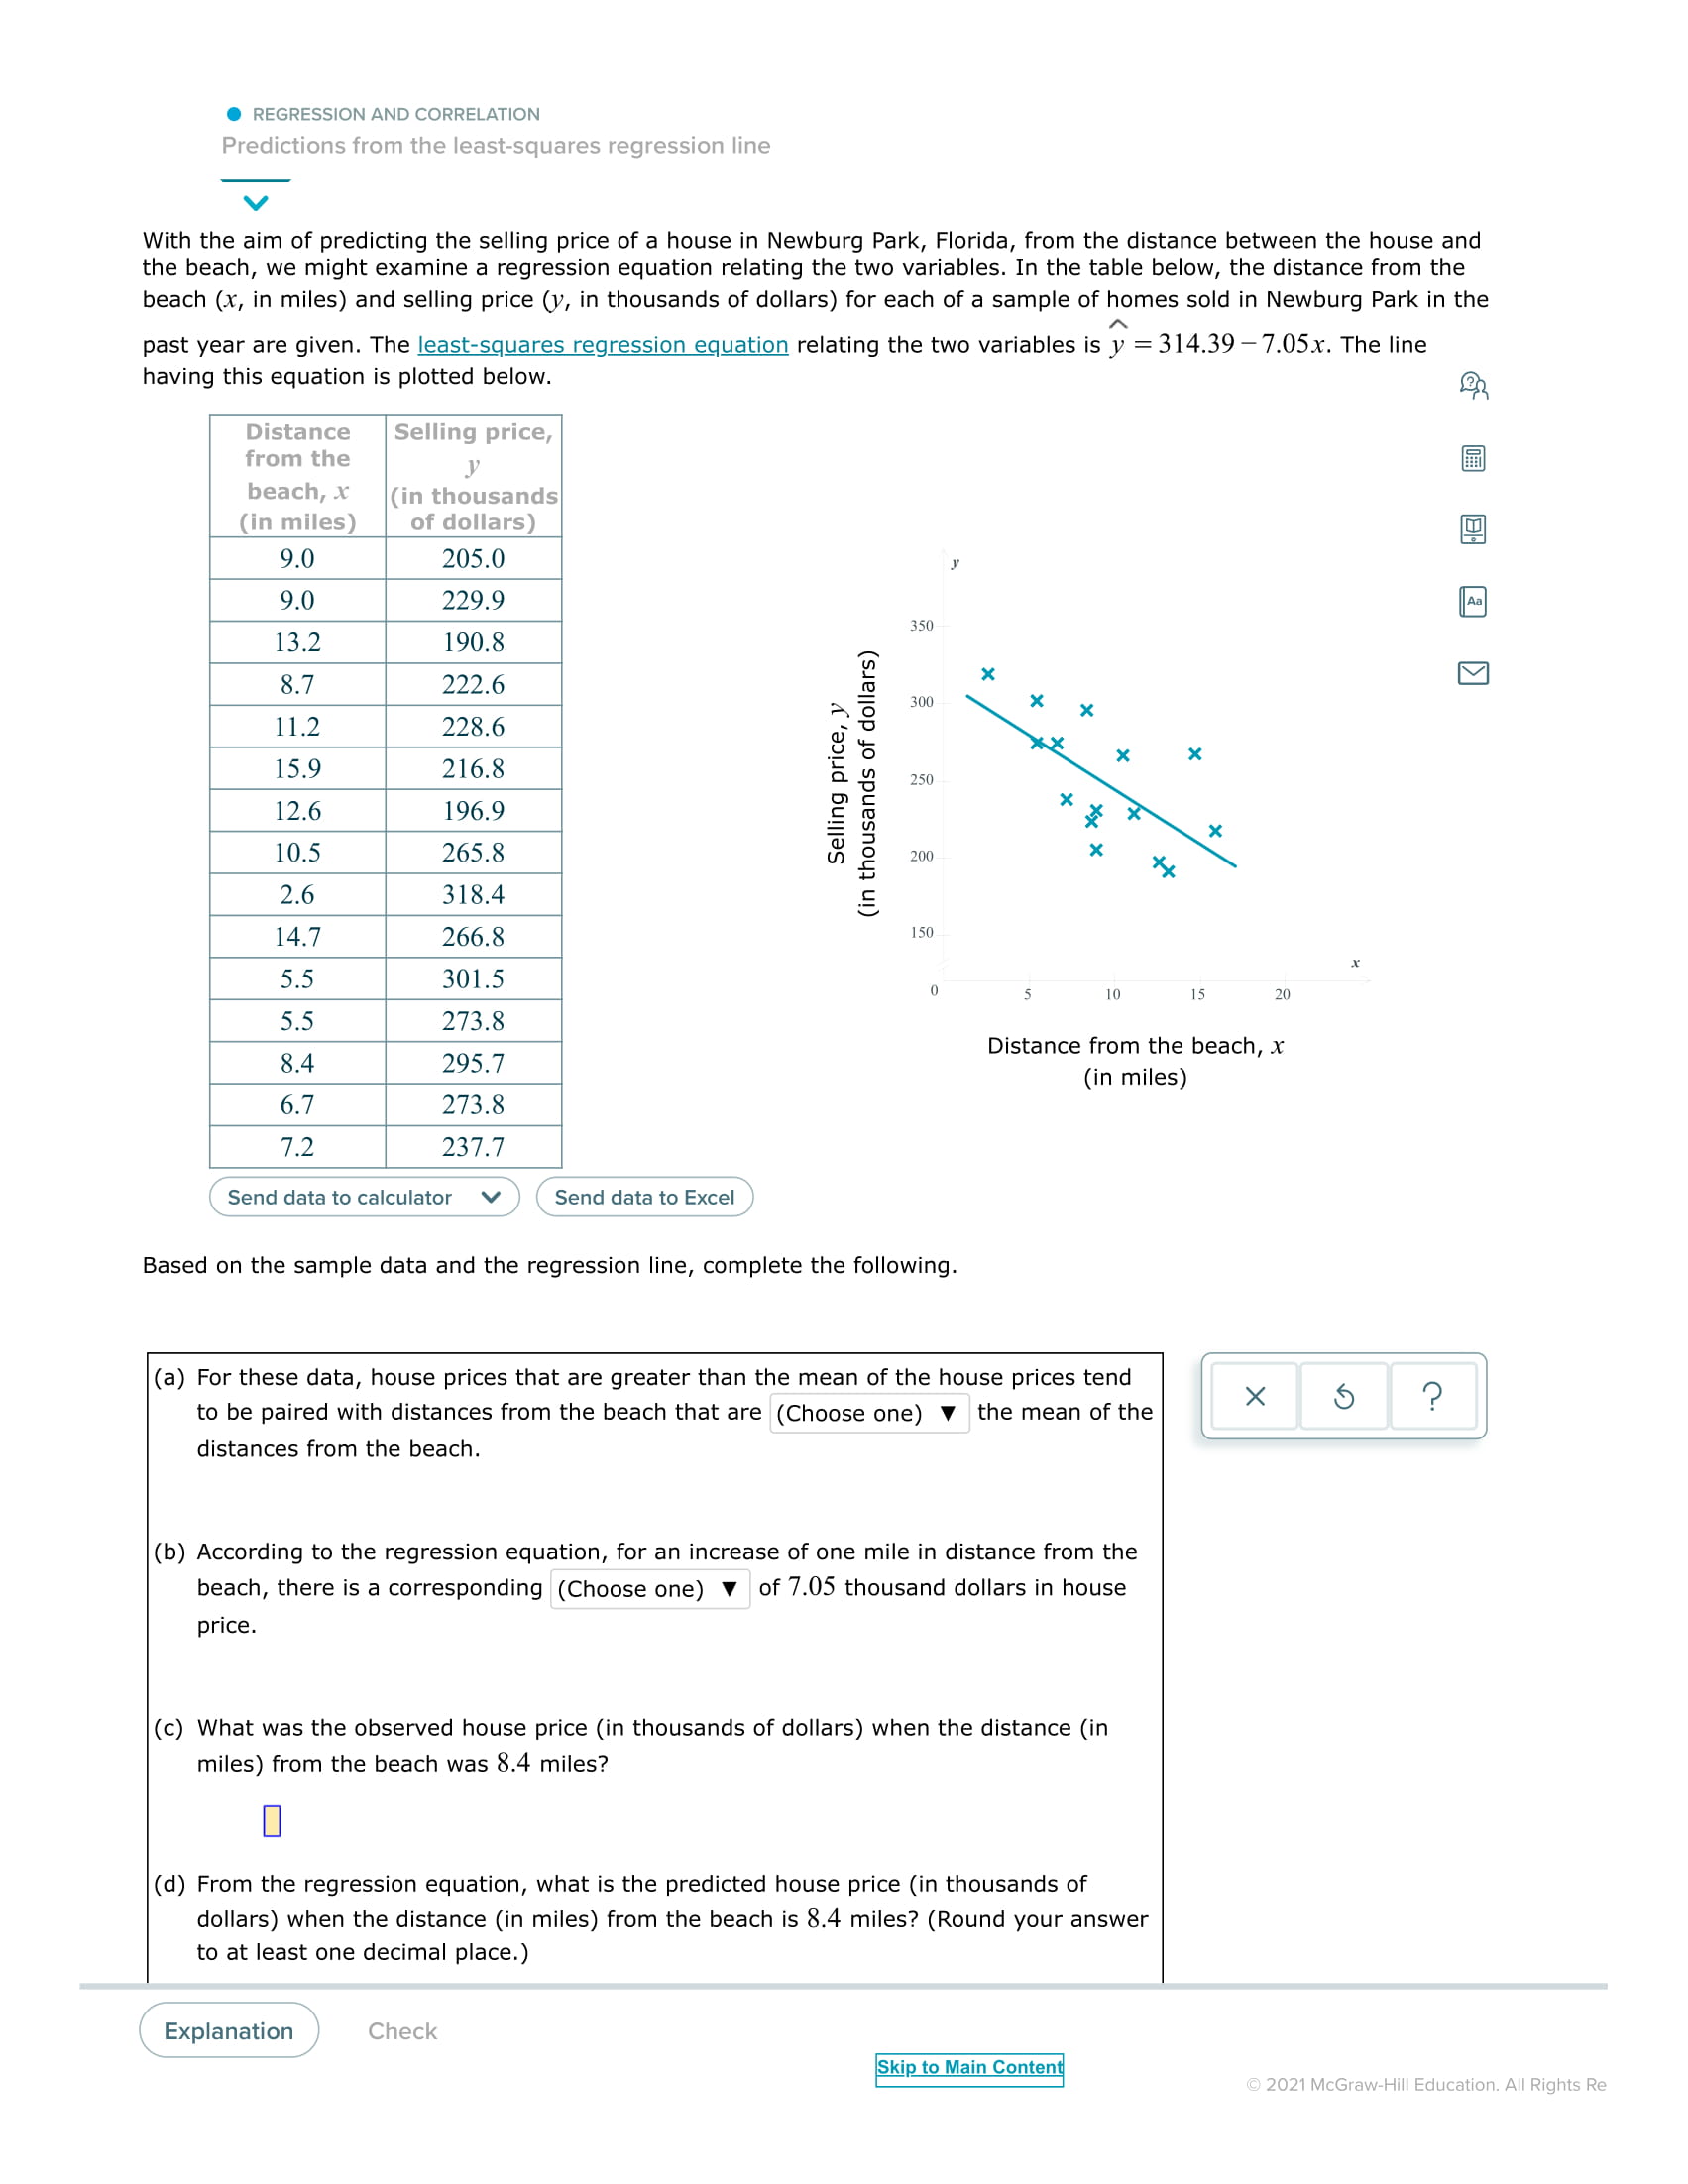
image text in transcribed
o REGRESSION AND CORRELATION Predictions from the least-squares regression line V With the aim of predicting the selling price of a house in Newburg Park, Florida, from the distance between the house and the beach, we might examine a regression equation relating the two variables. In the table below, the distance from the beach (x, in miles) and selling price (y, in thousands of dollars) for each of a sample of homes sold in Newburg Park in the A past year are given. The least-squares regression equation relating the two variables is y = 314.39 -7.05x. The line having this equation is plotted below. 33 Distance Selling price, from the l' E beach, 1' (in thousands (in miles) of dollars) 9.0 9.0 13.2 8.7 11.2 15.9 12.6 10.5 2.6 14.7 5.5 5.5 8.4 6.7 7.2 (Send data to calculator V) (Send data to Excel) HE 350 I 300 250 Selling price, y (in thousands of dollars) ISO 0 5 In is 20 Distance from the beach, x (in miles) Based on the sample data and the regression line, complete the following. (a) For these data, house prices that are greater than the mean of the house prices tend to be paired with distances from the beach that are (Choose one) v the mean of the distances from the beach. (b) According to the regression equation, for an increase of one mile in distance from the beach, there is a corresponding (Choose one) V of 7.05 thousand dollars in house price. (c) What was the observed house price (in thousands of dollars) when the distance (in miles) from the beach was 8.4 miles? I] (d) From the regression equation, what is the predicted house price (in thousands of dollars) when the distance (in miles) from the beach is 8.4 miles? (Round your answer to at least one decimal place.) Explanation Check Skip to Main Canton - 2021 McGiaerili Education. All Rights Re

Step by Step Solution

There are 3 Steps involved in it

Step: 1

blur-text-image

Get Instant Access to Expert-Tailored Solutions

See step-by-step solutions with expert insights and AI powered tools for academic success

Step: 2

blur-text-image

Step: 3

blur-text-image

Ace Your Homework with AI

Get the answers you need in no time with our AI-driven, step-by-step assistance

Get Started

Recommended Textbook for

Algebra And Trigonometry Enhanced With Graphing Utilities (Subscription)

Authors: Michael, Michael Sullivan III, Michael III Sullivan, Michael Sullivan 111, III Sullivan

6th Edition

0321849132, 9780321849137

More Books

Students also viewed these Mathematics questions

Question

Calculate the missing quantities four-figure accuracy.

Answered: 1 week ago