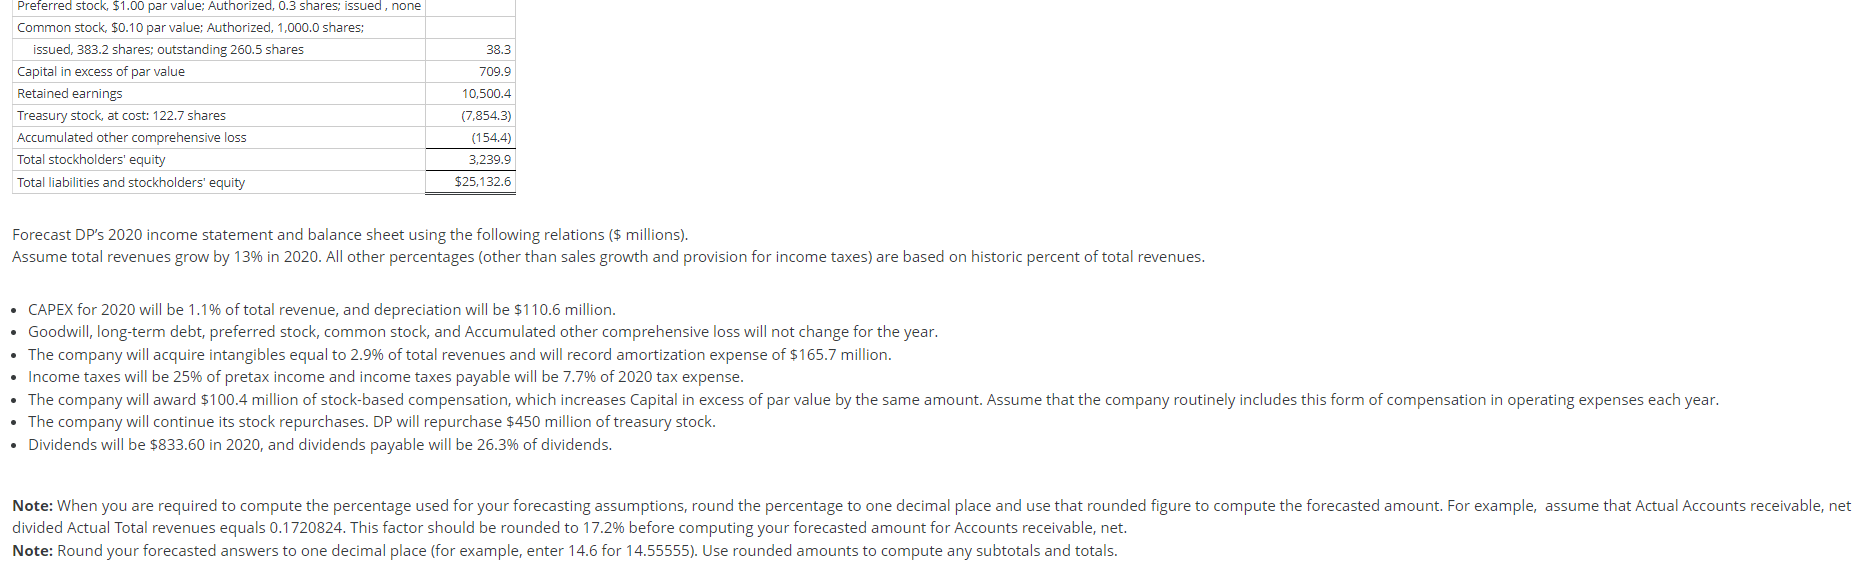
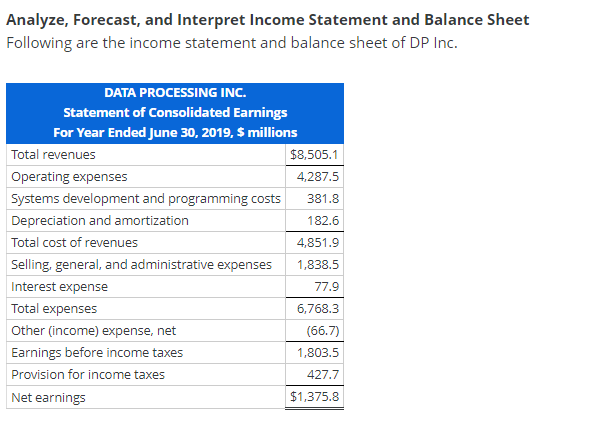
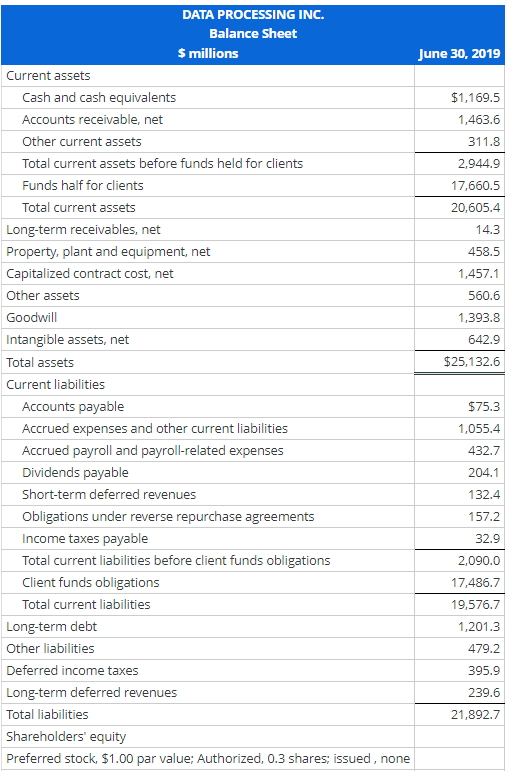
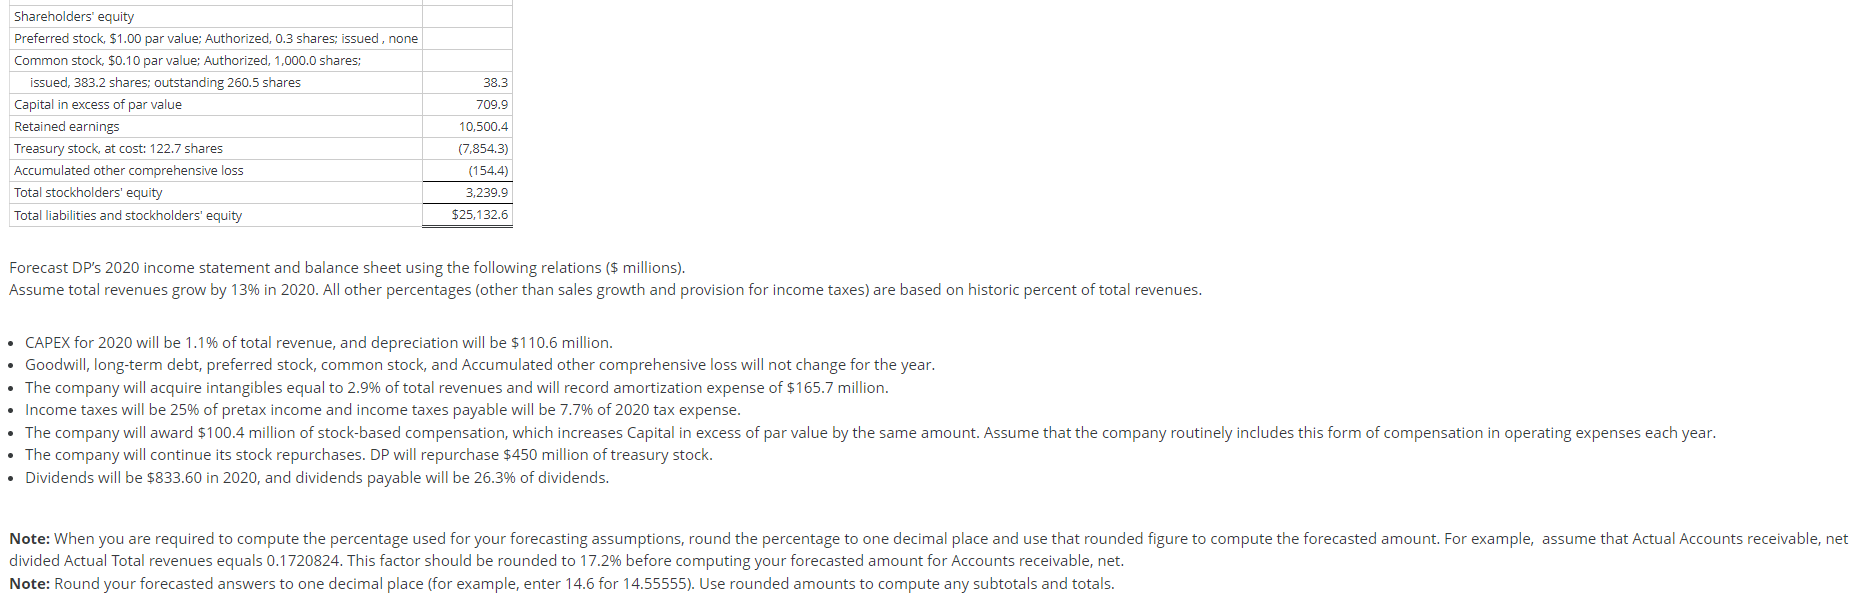
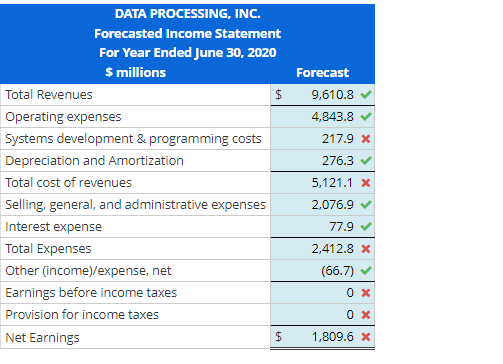
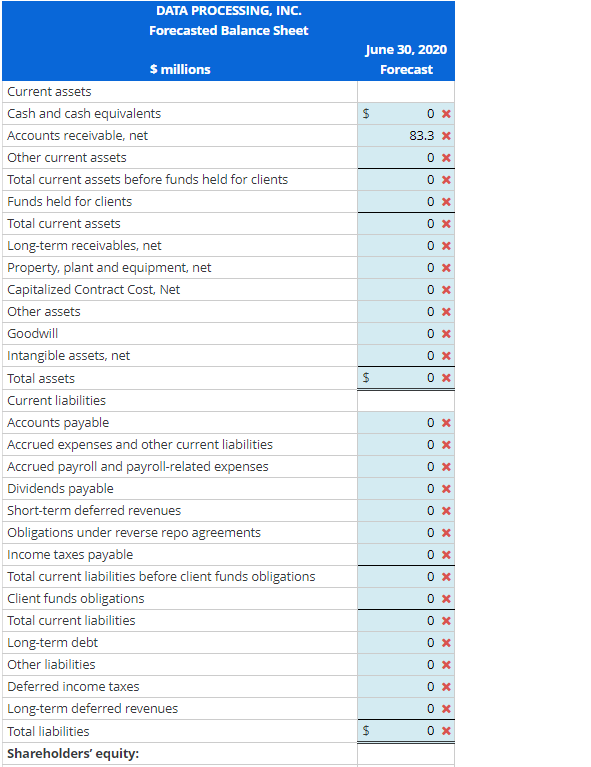
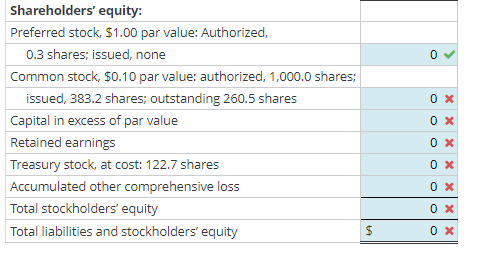
Preferred stock $1.00 par value; Authorized, 0.3 shares, issued, none Common stock $0.10 par value; Authorized, 1,000.0 shares; issued, 383.2 shares; outstanding 260.5 shares Capital in excess of par value Retained earnings Treasury stock, at cost: 122.7 shares Accumulated other comprehensive loss Total stockholders' equity Total liabilities and stockholders' equity 38.3 709.9 10.500.4 (7.854.3) (154.4) 3,239.9 $25,132.6 Forecast DP's 2020 income statement and balance sheet using the following relations ($ millions). Assume total revenues grow by 13% in 2020. All other percentages (other than sales growth and provision for income taxes) are based on historic percent of total revenues. CAPEX for 2020 will be 1.1% of total revenue, and depreciation will be $110.6 million. Goodwill, long-term debt, preferred stock, common stock, and Accumulated other comprehensive loss will not change for the year. The company will acquire intangibles equal to 2.9% of total revenues and will record amortization expense of $165.7 million. Income taxes will be 25% of pretax income and income taxes payable will be 7.7% of 2020 tax expense. The company will award $100.4 million of stock-based compensation, which increases Capital in excess of par value by the same amount. Assume that the company routinely includes this form of compensation in operating expenses each year. The company will continue its stock repurchases. DP will repurchase $450 million of treasury stock. Dividends will be $833.60 in 2020, and dividends payable will be 26.3% of dividends. Note: When you are required to compute the percentage used for your forecasting assumptions, round the percentage to one decimal place and use that rounded figure to compute the forecasted amount. For example, assume that Actual Accounts receivable, net divided Actual Total revenues equals 0.1720824. This factor should be rounded to 17.2% before computing your forecasted amount for Accounts receivable, net. Note: Round your forecasted answers to one decimal place (for example, enter 14.6 for 14.55555). Use rounded amounts to compute any subtotals and totals. Analyze, Forecast, and Interpret Income Statement and Balance Sheet Following are the income statement and balance sheet of DP Inc. DATA PROCESSING INC. Statement of Consolidated Earnings For Year Ended June 30, 2019, $ millions Total revenues $8,505.1 Operating expenses 4,287.5 Systems development and programming costs 381.8 Depreciation and amortization 182.6 Total cost of revenues 4,851.9 Selling, general, and administrative expenses 1,838.5 Interest expense 77.9 Total expenses 6,768.3 Other (income) expense, net (66.7) Earnings before income taxes 1,803.5 Provision for income taxes 427.7 Net earnings $1,375.8 June 30, 2019 $1,169.5 1,463.6 311.8 2.944.9 17,660.5 20,605.4 14.3 458.5 1,457.1 560.6 1,393.8 642.9 $25,132.6 DATA PROCESSING INC. Balance Sheet $ millions Current assets Cash and cash equivalents Accounts receivable, net Other current assets Total current assets before funds held for clients Funds half for clients Total current assets Long-term receivables, net Property, plant and equipment, net Capitalized contract cost, net Other assets Goodwill Intangible assets, net Total assets Current liabilities Accounts payable Accrued expenses and other current liabilities Accrued payroll and payroll-related expenses Dividends payable Short-term deferred revenues Obligations under reverse repurchase agreements Income taxes payable Total current liabilities before client funds obligations Client funds obligations Total current liabilities Long-term debt Other liabilities Deferred income taxes Long-term deferred revenues Total liabilities Shareholders' equity Preferred stock, $1.00 par value; Authorized, 0.3 shares; issued, none $75.3 1,055.4 432.7 204.1 132.4 157.2 32.9 2,090.0 17,486.7 19,576.7 1,201.3 479.2 395.9 239.6 21,892.7 Shareholders' equity Preferred stock, $1.00 par value; Authorized, 0.3 shares; issued, none Common stock, $0.10 par value; Authorized, 1,000.0 shares; issued, 383.2 shares; outstanding 260.5 shares Capital in excess of par value Retained earnings Treasury stock, at cost: 122.7 shares Accumulated other comprehensive loss Total stockholders' equity Total liabilities and stockholders' equity 38.3 709.9 10.500.4 (7,854.3) (154.4) 3,239.9 $25,132.6 Forecast DP's 2020 income statement and balance sheet using the following relations ($ millions). Assume total revenues grow by 13% in 2020. All other percentages (other than sales growth and provision for income taxes) are based on historic percent of total revenues. CAPEX for 2020 will be 1.1% of total revenue, and depreciation will be $110.6 million. Goodwill, long-term debt, preferred stock, common stock, and Accumulated other comprehensive loss will not change for the year. The company will acquire intangibles equal to 2.9% of total revenues and will record amortization expense of $165.7 million. Income taxes will be 25% of pretax income and income taxes payable will be 7.7% of 2020 tax expense. The company will award $100.4 million of stock-based compensation, which increases Capital in excess of par value by the same amount. Assume that the company routinely includes this form of compensation in operating expenses each year. The company will continue its stock repurchases. DP will repurchase $450 million of treasury stock. Dividends will be $833.60 in 2020, and dividends payable will be 26.3% of dividends. Note: When you are required to compute the percentage used for your forecasting assumptions, round the percentage to one decimal place and use that rounded figure to compute the forecasted amount. For example, assume that Actual Accounts receivable, net divided Actual Total revenues equals 0.1720824. This factor should be rounded to 17.2% before computing your forecasted amount for Accounts receivable, net. Note: Round your forecasted answers to one decimal place (for example, enter 14.6 for 14.55555). Use rounded amounts to compute any subtotals and totals. DATA PROCESSING, INC. Forecasted Income Statement For Year Ended June 30, 2020 $ millions Total Revenues $ Operating expenses Systems development & programming costs Depreciation and Amortization Total cost of revenues Selling, general, and administrative expenses Interest expense Total Expenses Other (income)/expense, net Earnings before income taxes Provision for income taxes Net Earnings Forecast 9,610.8 4,843.8 217.9 X 276.3 5,121.1 x 2,076.9 77.9 2,412.8 x (66.7) $ 1,809.6 x DATA PROCESSING, INC. Forecasted Balance Sheet June 30, 2020 Forecast $ 83.3 x OX 0 X 0x OX 0X OX OX $ $ millions Current assets Cash and cash equivalents Accounts receivable, net Other current assets Total current assets before funds held for clients Funds held for clients Total current assets Long-term receivables, net Property, plant and equipment, net Capitalized Contract Cost, Net Other assets Goodwill Intangible assets, net Total assets Current liabilities Accounts payable Accrued expenses and other current liabilities Accrued payroll and payroll-related expenses Dividends payable Short-term deferred revenues Obligations under reverse repo agreements Income taxes payable Total current liabilities before client funds obligations Client funds obligations Total current liabilities Long-term debt Other liabilities Deferred income taxes Long-term deferred revenues Total liabilities Shareholders' equity: 0 x 0X OX 0X OX OX 0 x 0X $ OX 0 > 0X Shareholders' equity: Preferred stock, $1.00 par value: Authorized, 0.3 shares; issued, none Common stock $0.10 par value: authorized, 1,000.0 shares; issued, 383.2 shares; outstanding 260.5 shares Capital in excess of par value Retained earnings Treasury stock, at cost: 122.7 shares Accumulated other comprehensive loss Total stockholders' equity Total liabilities and stockholders' equity OX 0 x 0X $ Preferred stock $1.00 par value; Authorized, 0.3 shares, issued, none Common stock $0.10 par value; Authorized, 1,000.0 shares; issued, 383.2 shares; outstanding 260.5 shares Capital in excess of par value Retained earnings Treasury stock, at cost: 122.7 shares Accumulated other comprehensive loss Total stockholders' equity Total liabilities and stockholders' equity 38.3 709.9 10.500.4 (7.854.3) (154.4) 3,239.9 $25,132.6 Forecast DP's 2020 income statement and balance sheet using the following relations ($ millions). Assume total revenues grow by 13% in 2020. All other percentages (other than sales growth and provision for income taxes) are based on historic percent of total revenues. CAPEX for 2020 will be 1.1% of total revenue, and depreciation will be $110.6 million. Goodwill, long-term debt, preferred stock, common stock, and Accumulated other comprehensive loss will not change for the year. The company will acquire intangibles equal to 2.9% of total revenues and will record amortization expense of $165.7 million. Income taxes will be 25% of pretax income and income taxes payable will be 7.7% of 2020 tax expense. The company will award $100.4 million of stock-based compensation, which increases Capital in excess of par value by the same amount. Assume that the company routinely includes this form of compensation in operating expenses each year. The company will continue its stock repurchases. DP will repurchase $450 million of treasury stock. Dividends will be $833.60 in 2020, and dividends payable will be 26.3% of dividends. Note: When you are required to compute the percentage used for your forecasting assumptions, round the percentage to one decimal place and use that rounded figure to compute the forecasted amount. For example, assume that Actual Accounts receivable, net divided Actual Total revenues equals 0.1720824. This factor should be rounded to 17.2% before computing your forecasted amount for Accounts receivable, net. Note: Round your forecasted answers to one decimal place (for example, enter 14.6 for 14.55555). Use rounded amounts to compute any subtotals and totals. Analyze, Forecast, and Interpret Income Statement and Balance Sheet Following are the income statement and balance sheet of DP Inc. DATA PROCESSING INC. Statement of Consolidated Earnings For Year Ended June 30, 2019, $ millions Total revenues $8,505.1 Operating expenses 4,287.5 Systems development and programming costs 381.8 Depreciation and amortization 182.6 Total cost of revenues 4,851.9 Selling, general, and administrative expenses 1,838.5 Interest expense 77.9 Total expenses 6,768.3 Other (income) expense, net (66.7) Earnings before income taxes 1,803.5 Provision for income taxes 427.7 Net earnings $1,375.8 June 30, 2019 $1,169.5 1,463.6 311.8 2.944.9 17,660.5 20,605.4 14.3 458.5 1,457.1 560.6 1,393.8 642.9 $25,132.6 DATA PROCESSING INC. Balance Sheet $ millions Current assets Cash and cash equivalents Accounts receivable, net Other current assets Total current assets before funds held for clients Funds half for clients Total current assets Long-term receivables, net Property, plant and equipment, net Capitalized contract cost, net Other assets Goodwill Intangible assets, net Total assets Current liabilities Accounts payable Accrued expenses and other current liabilities Accrued payroll and payroll-related expenses Dividends payable Short-term deferred revenues Obligations under reverse repurchase agreements Income taxes payable Total current liabilities before client funds obligations Client funds obligations Total current liabilities Long-term debt Other liabilities Deferred income taxes Long-term deferred revenues Total liabilities Shareholders' equity Preferred stock, $1.00 par value; Authorized, 0.3 shares; issued, none $75.3 1,055.4 432.7 204.1 132.4 157.2 32.9 2,090.0 17,486.7 19,576.7 1,201.3 479.2 395.9 239.6 21,892.7 Shareholders' equity Preferred stock, $1.00 par value; Authorized, 0.3 shares; issued, none Common stock, $0.10 par value; Authorized, 1,000.0 shares; issued, 383.2 shares; outstanding 260.5 shares Capital in excess of par value Retained earnings Treasury stock, at cost: 122.7 shares Accumulated other comprehensive loss Total stockholders' equity Total liabilities and stockholders' equity 38.3 709.9 10.500.4 (7,854.3) (154.4) 3,239.9 $25,132.6 Forecast DP's 2020 income statement and balance sheet using the following relations ($ millions). Assume total revenues grow by 13% in 2020. All other percentages (other than sales growth and provision for income taxes) are based on historic percent of total revenues. CAPEX for 2020 will be 1.1% of total revenue, and depreciation will be $110.6 million. Goodwill, long-term debt, preferred stock, common stock, and Accumulated other comprehensive loss will not change for the year. The company will acquire intangibles equal to 2.9% of total revenues and will record amortization expense of $165.7 million. Income taxes will be 25% of pretax income and income taxes payable will be 7.7% of 2020 tax expense. The company will award $100.4 million of stock-based compensation, which increases Capital in excess of par value by the same amount. Assume that the company routinely includes this form of compensation in operating expenses each year. The company will continue its stock repurchases. DP will repurchase $450 million of treasury stock. Dividends will be $833.60 in 2020, and dividends payable will be 26.3% of dividends. Note: When you are required to compute the percentage used for your forecasting assumptions, round the percentage to one decimal place and use that rounded figure to compute the forecasted amount. For example, assume that Actual Accounts receivable, net divided Actual Total revenues equals 0.1720824. This factor should be rounded to 17.2% before computing your forecasted amount for Accounts receivable, net. Note: Round your forecasted answers to one decimal place (for example, enter 14.6 for 14.55555). Use rounded amounts to compute any subtotals and totals. DATA PROCESSING, INC. Forecasted Income Statement For Year Ended June 30, 2020 $ millions Total Revenues $ Operating expenses Systems development & programming costs Depreciation and Amortization Total cost of revenues Selling, general, and administrative expenses Interest expense Total Expenses Other (income)/expense, net Earnings before income taxes Provision for income taxes Net Earnings Forecast 9,610.8 4,843.8 217.9 X 276.3 5,121.1 x 2,076.9 77.9 2,412.8 x (66.7) $ 1,809.6 x DATA PROCESSING, INC. Forecasted Balance Sheet June 30, 2020 Forecast $ 83.3 x OX 0 X 0x OX 0X OX OX $ $ millions Current assets Cash and cash equivalents Accounts receivable, net Other current assets Total current assets before funds held for clients Funds held for clients Total current assets Long-term receivables, net Property, plant and equipment, net Capitalized Contract Cost, Net Other assets Goodwill Intangible assets, net Total assets Current liabilities Accounts payable Accrued expenses and other current liabilities Accrued payroll and payroll-related expenses Dividends payable Short-term deferred revenues Obligations under reverse repo agreements Income taxes payable Total current liabilities before client funds obligations Client funds obligations Total current liabilities Long-term debt Other liabilities Deferred income taxes Long-term deferred revenues Total liabilities Shareholders' equity: 0 x 0X OX 0X OX OX 0 x 0X $ OX 0 > 0X Shareholders' equity: Preferred stock, $1.00 par value: Authorized, 0.3 shares; issued, none Common stock $0.10 par value: authorized, 1,000.0 shares; issued, 383.2 shares; outstanding 260.5 shares Capital in excess of par value Retained earnings Treasury stock, at cost: 122.7 shares Accumulated other comprehensive loss Total stockholders' equity Total liabilities and stockholders' equity OX 0 x 0X $