Answered step by step
Verified Expert Solution
Question
1 Approved Answer
Preforming an audit. Exercise 1 problems a, b and c please. Auditing** Exercise 1 problems a, b and c please! Thanks EXERCISE (1) Using the
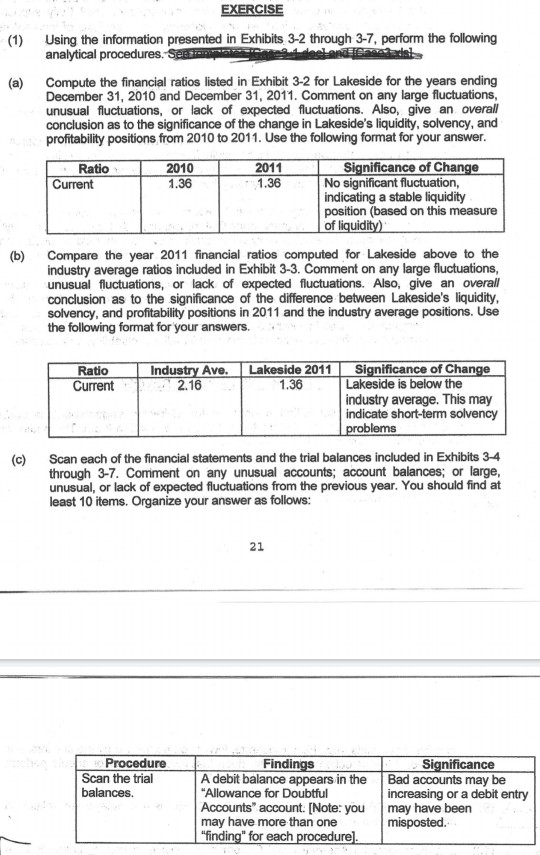
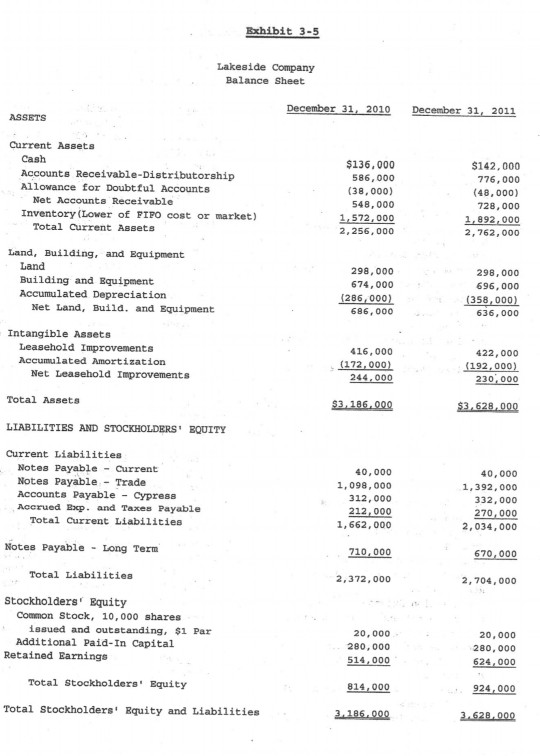
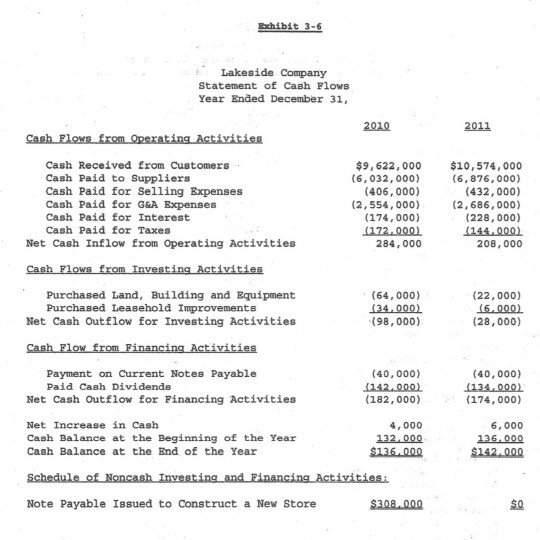
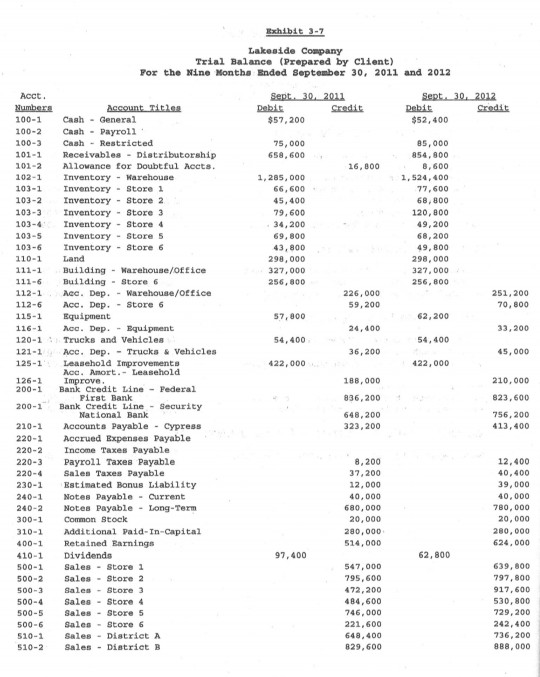
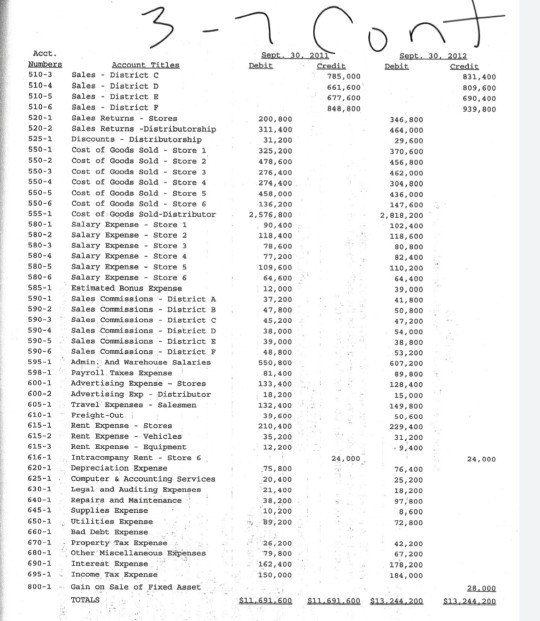
Preforming an audit. Exercise 1 problems a, b and c please.
Auditing** Exercise 1 problems a, b and c please! Thanks
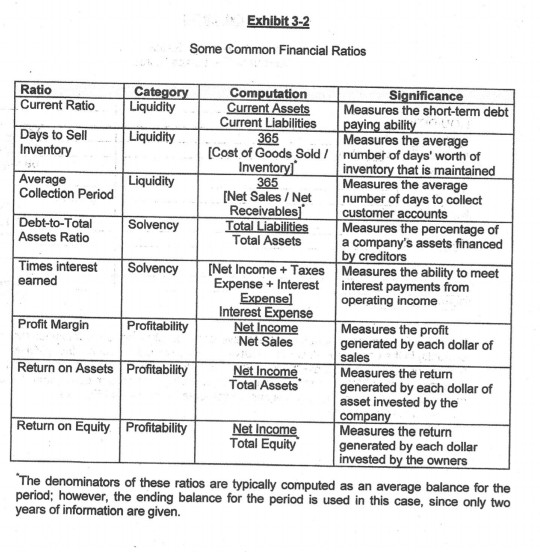
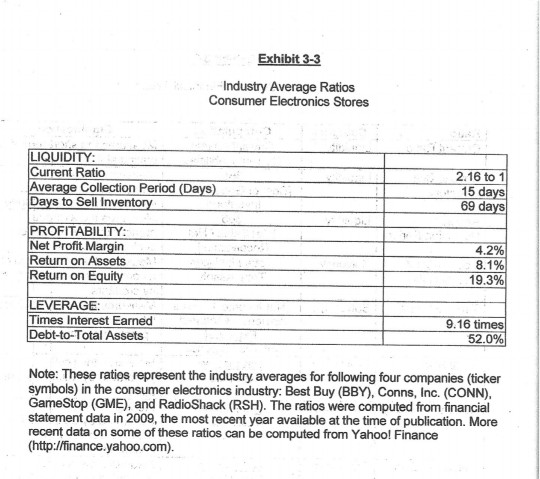
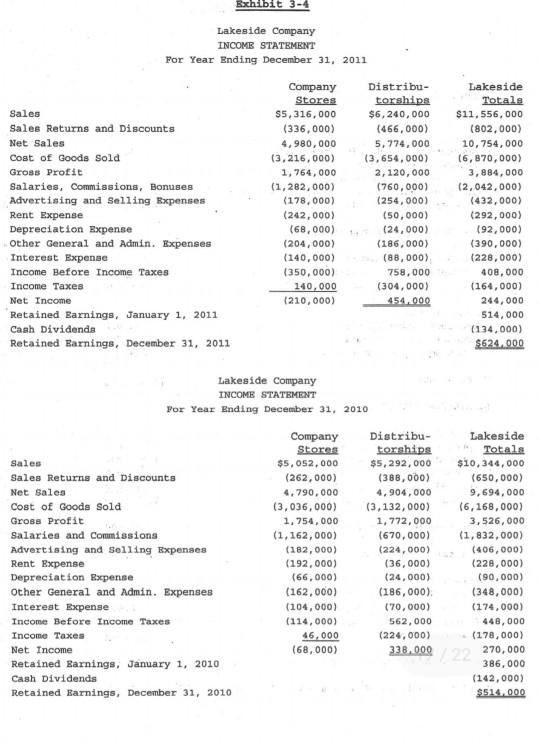
EXERCISE (1) Using the information presented in Exhibits 3-2 through 3-7, perform the following analytical procedures. See S e elanda st Compute the financial ratios listed in Exhibit 3-2 for Lakeside for the years ending December 31, 2010 and December 31, 2011. Comment on any large fluctuations, unusual fluctuations, or lack of expected fluctuations. Also, give an overall conclusion as to the significance of the change in Lakeside's liquidity, solvency, and profitability positions from 2010 to 2011. Use the following format for your answer. Ratio Current 2010 1.36 2011 1.36 Significance of Change No significant fluctuation, indicating a stable liquidity position (based on this measure of liquidity) (b) Compare the year 2011 financial ratios computed for Lakeside above to the industry average ratios included in Exhibit 3-3. Comment on any large fluctuations, unusual fluctuations, or lack of expected fluctuations. Also, give an overall conclusion as to the significance of the difference between Lakeside's liquidity, solvency, and profitability positions in 2011 and the industry average positions. Use the following format for your answers. Ratio Current Industry Ave. 2.16 Lakeside 2011 1.36 Significance of Change Lakeside is below the industry average. This may indicate short-term solvency problems (c) Scan each of the financial statements and the trial balances included in Exhibits 3-4 through 3-7. Comment on any unusual accounts; account balances; or large, unusual, or lack of expected fluctuations from the previous year. You should find at least 10 items. Organize your answer as follows: 21 Procedure Scan the trial balances Findings A debit balance appears in the "Allowance for Doubtful Accounts account. [Note: you may have more than one "finding" for each procedure). Significance Bad accounts may be increasing or a debit entry may have been misposted. Exhibit 3-2 Some Common Financial Ratios Ratio Current Ratio Category Liquidity Liquidity Days to Sell Inventory Liquidity Average Collection Period Debt-to-Total Assets Ratio Solvency Computation Significance Current Assets Measures the short-term debt Current Liabilities paying ability 365 Measures the average (Cost of Goods Sold / number of days' worth of Inventory inventory that is maintained 365 Measures the average [Net Sales / Net number of days to collect Receivables customer accounts Total Liabilities Measures the percentage of Total Assets a company's assets financed by creditors Measures the ability to meet Expense + Interest interest payments from Expensel operating income Interest Expense Net Income Measures the profit Net Sales generated by each dollar of sales Net Income Measures the return Total Assets generated by each dollar of asset invested by the company Net Income Measures the return Total Equity generated by each dollar invested by the owners earned Profit Margin Profitability Return on Assets Profitability Return on Equity Profitability The denominators of these ratios are typically computed as an average balance for the period; however, the ending balance for the period is used in this case, since only two years of information are given. Exhibit 3-3 Industry Average Ratios Consumer Electronics Stores LIQUIDITY: Current Ratio Average Collection Period (Days) Days to Sell Inventory 2.16 to 1 15 days 69 days PROFITABILITY: Net Profit Margin Return on Assets Return on Equity 4.2% 8.1% 19.3% LEVERAGE Times Interest Earned Debt-to-Total Assets 9.16 times 52.0% Note: These ratios represent the industry averages for following four companies (ticker symbols) in the consumer electronics industry: Best Buy (BBY), Conns, Inc. (CONN). GameStop (GME), and RadioShack (RSH). The ratios were computed from financial statement data in 2009, the most recent year available at the time of publication. More recent data on some of these ratios can be computed from Yahool Finance (http://finance.yahoo.com). Exhibit 3-4 Lakeside Company INCOME STATEMENT For Year Ending December 31, 2011 Sales Sales Returns and Discounts Net Sales Coat of Goods Sold Gross Profit Salaries, Commissions, Bonuses Advertising and Selling Expenses Rent Expense Depreciation Expense Other General and Admin. Expenses Interest Expense Income Before Income Taxes Income Taxes Net Income Retained Earnings, January 1, 2011 Cash Dividends Retained Earnings, December 31, 2011 Company Stores $5,316,000 (336,000) 4,980,000 (3,216,000) 1,764,000 (1,282,000) (178,000) (242, 000) (68,000) (204,000) (140,000) (350,000) 140,000 (210,000) Distribu- torships $6,240,000 (466,000) 5,774,000 (3,654,000) 2,120,000 (760,000) (254, 000) (50,000) (24,000) (186, 000) (88,000) 758,000 (304,000) 454,000 Lakeside Totals $11,556,000 (802,000) 10, 754,000 (6,870,000) 3,884,000 (2,042,000) (432,000) (292,000) (92,000) (390,000) (228,000) 408,000 (164, 000) 244,000 514,000 (134,000) $624.000 Lakeside Company INCOME STATEMENT Por Year Ending December 31, 2010 Sales Sales Returns and Discounts Net Sales Cost of Goods Sold Gross Profit Salaries and Commissions Advertising and selling Expenses Rent Expense Depreciation Expense Other General and Admin. Expenses Interest Expense Income Before Income Taxes Income Taxes Net Income Retained Earnings, January 1, 2010 Cash Dividends Retained Earnings, December 31, 2010 Company Stores $5,052,000 (262,000) 4,790,000 (3,036,000) 1,754,000 (1,162,000) (182,000) (192,000) (66,000) (162,000) (104,000) (114,000) 46,000 (68,000) Distribu- torships $5,292,000 (388,000) 4,904,000 (3,132,000) 1,772,000 (670,000) (224,000) (36,000) (24,000) (186,000) (70,000) 562,000 (224,000) 338.000 Lakeside Totals $10,344,000 (650,000) 9,694,000 (6, 168,000) 3,526,000 (1,832,000) (406,000) (228,000) (90,000) (348,000) (174,000) 448,000 (178,000) 270,000 386,000 (142,000) $514,000 Exhibit 3-5 Lakeside Company Balance Sheet December 31, 2010 December 31, 2011 ASSETS Current Assets Cash Accounts Receivable-Distributorship Allowance for Doubtful Accounts Net Accounts Receivable Inventory (Lower of PIPO cost or market) Total Current Assets $136.000 586,000 (38,000) 548,000 1,572,000 2,256,000 $142.000 776,000 (48,000) 728,000 1,892,000 2,762,000 Land, Building, and Equipment Land Building and Equipment Accumulated Depreciation Net Land, Build, and Equipment 298,000 674,000 (286,000) 686,000 298,000 696,000 (358,000) 636,000 Intangible Assets Leasehold Improvements Accumulated Amortization Net Leasehold Improvements 416,000 (172,000) 244,000 422,000 (192,000) 230,000 Total Assets $3,186.000 $3.628.000 LIABILITIES AND STOCKHOLDERS' EQUITY Current Liabilities Notes Payable - Current Notes Payable - Trade Accounts Payable - Cypress Accrued Bp. and Taxes Payable Total Current Liabilities 40,000 1,098,000 312,000 212,000 1, 662,000 40,000 1,392,000 332,000 270,000 2,034,000 Notes Payable - Long Term 710,000 670,000 Total Liabilities 2,372,000 2,704,000 Stockholders' Equity Common Stock, 10,000 shares issued and outstanding. $1 Par Additional Paid-In Capital Retained Earnings 20,000 280,000 514,000 20,000 280,000 624,000 Total stockholders' Equity 814.000 924,000 Total Stockholders' Equity and Liabilities 2.185.000 3.628.000 chibit 3-6 Lakeside Company Statement of Cash Flows Year Ended December 31, 2010 2011 Cash Flows from Operating Activities Cash Received from Customers Cash Paid to Suppliers Cash Paid for Selling Expenses Cash Paid for G&A Expenses Cash Paid for Interest Cash Paid for Taxes Net Cash Inflow from Operating Activities $9,622,000 (6,032, 000) (406,000) (2,554,000) (174,000) 0172.000). 284,000 $10,574,000 (6,876, 000) (432,000) (2,686,000) (228,000) 144.000) 208,000 Cash Flows from Investing Activities Purchased Land, Building and Equipment Purchased Leasehold Improvements Net Cash Outflow for Investing Activities (64,000) (34.000) (98,000) (22,000) (6.000). (28,000) Cash Flow from Financing Activities Payment on Current Notes Payable Paid Cash Dividends Net Cash Outflow for Financing Activities (40,000) (142.000) (182,000) (40,000) (134.000) (174,000) Net Increase in Cash Cash Balance at the Beginning of the Year Cash Balance at the End of the Year 4,000 132.000 $136.000 6,000 236.000 $142.000 Schedule of Noncash Investing and Financing Activities: Note Payable Issued to construct a New Store $308.000 Exhibit 3-7 Lakeside Company Trial Balance (Prepared by Client) For the Nine Months Ended September 30, 2011 and 2012 Sept. 30, 2011 Debit Credit $57,200 Sept. 30, 2012 Debit Credit $52,400 Acct. Numbers 100-1 100-2 100-3 101-1 101-2 102-1 103-1 103-2 103-3 103-4 75,000 658,600 16,800 1,285,000 66,600 45,400 79,600 34,200 69,800 43,800 298,000 327,000 256,800 85,000 854.800 8.600 1,524,400 77,600 68,800 120,000 49,200 68,200 49,800 298,000 327,000 256,800 103-6 110-1 111-1 111-6 112-1 112-6 115-1 116-1 120-1 121-1 125-1 226,000 59,200 251, 200 70, 800 57,200 62,200 24,400 33,200 54,400 54,400 36,200 45,000 422,000 422,000 126-1 200-1 200-1 Account Titles Cash - General Cash - Payroll Caah - Restricted Receivables - Distributorship Allowance for Doubtful Acets. Inventory - Warehouse Inventory - Store 1 Invento Inventory - Store 2 Inventory - Store 3 Inventory - Store 4 Inventory - Store 5 Inventory - Store 6 Land Building - Warehouse/Office Building - Store 6 Acc. Dep. - Warehouse/Office Acc. Dep. - Store 6 Equipment o. Dep. - Equipment Trucks and Vehicles Acc. Dep. - Trucks & Vehicles Leasehold Improvements Acc. Amort.- Leasehold Improve Bank Credit Line - Federal Pirst Bank Bank Credit Line - Security National Bank Accounts Payable - Cypress Accrued Expenses Payable Income Taxes Payable Payroll Taxes Payable Sales Taxes Payable Estimated Bonus Liability Notes Payable - Current Notes Payable - Long-Term Common Stock Additional Paid-In-Capital Retained Rarnings Dividends Sales - Store 1 Sales - Store 2 Sales - Store 3 Sales - Store 4 Sales - Store 5 Sales - Store 6 Sales - District A Sales - District B 188,000 836,200 648,200 323,200 210,000 823,600 756,200 413,400 210-1 220-1 220-2 220-3 220-4 230-1 240-1 240-2 300-1 310-1 400-1 410-1 500-1 500-2 500-3 500-4 500-5 500-6 510-1 510-2 8,200 37,200 12,000 40,000 680,000 20,000 280,000 514,000 12,400 40,400 39,000 40,000 780,000 20,000 280,000 624,000 97,400 62,800 547,000 795,600 472,200 484,600 746,000 221,600 648,400 829,600 639,800 797.800 917,600 530, 800 729, 200 242,400 736,200 888,000 -Ico Mect. be 510-) 510-4 510-5 510-6 520-1 520-2 550-1 550-2 550-3 550-4 550-6 555-1 580-1 S80- 580-4 Sept.30. 2011 Debit 785,000 661,600 677.600 848,800 200.000 311.400 31.200 325, 200 470.600 276.400 274,400 450.000 136,200 2,576,800 90.000 118.400 78.500 77,200 109,600 64,600 12,000 37,200 47,800 45,200 38.000 39,000 40.800 550, 800 81,400 133,400 18,200 132,400 39.600 210, 400 35,200 12,200 Sept.10.2012 Det Credit 831,400 809,600 690.600 939,800 346,800 464.000 29,600 370,600 456.800 462,000 304,000 436,000 147.600 2,818,200 102,400 118,600 80, 800 82,400 110,200 64,400 39,000 41,800 50.800 47,200 54,000 38.800 53,200 507,200 09.00 128, 400 15,000 149,800 50, 500 229,400 31, 200 9.400 580-6 Accountries Sales - District C Sales - District D Sales - District E Sales - District 7 Sales Retur - Stores Sales Returns -Distributorship Discount - Distributorship Cost of Goods Sold - Store 1 Cost of Gooda Sold - Store 2 Cost of Goods Sold - Store 3 Coat of Goods Sold - Store 4 Coat of Goods Sold - Store 5 Cost of Goods Sold - Store Cost of Goods Sold-Distributor Salary Expense Store 1 Salary Expense - Store 2 Salary Expense - store ) Salary Expense - Store 4 Salary xpense - Store 5 Salary Expense - store 6 Estimated Bonus Expense Sales Commissions - District A Sales Commissions - District B Sales Commissions - District C Sales Comisione - District D Sales Comissions - District E Sales Commissions - District ? Admin And Warehouse Salaries Payroll Taxes Expense Advertising Expense - Stores Advertising Rp - Distributor Travel xpenses - Salesmen Freight-Out Rent Expense - Stores Rent Expense - Vehicles Rent Expense - Equipment Intracompany Rent - Store 6 Depreciation Expense Computer Accounting Services Legal and Auditing Expenses Nepair and Maintenance Supplies Expense Utilities Expense Bad Debt wense Property Tax pense Other Miscellaneous penses Interest pense Tncome Tax Expense Gain on sale of Pixed Asset TOTALS 590-1 590-2 590-) 590-6 595-1 590-1 600.1 600-2 605-1 610-1 615-1 615-3 620-1 625-1 630-1 640-1 645-1 75,800 20,400 21,400 38,200 10,200 39,200 76,000 25,200 18,200 97.100 0.600 72,800 670-1 680-1 26.200 79, 800 162,400 150.000 42,200 67,200 278,200 184,000 300-1 S11.591.50 S11.591.50 13.24.200 13.244.200 EXERCISE (1) Using the information presented in Exhibits 3-2 through 3-7, perform the following analytical procedures. See S e elanda st Compute the financial ratios listed in Exhibit 3-2 for Lakeside for the years ending December 31, 2010 and December 31, 2011. Comment on any large fluctuations, unusual fluctuations, or lack of expected fluctuations. Also, give an overall conclusion as to the significance of the change in Lakeside's liquidity, solvency, and profitability positions from 2010 to 2011. Use the following format for your answer. Ratio Current 2010 1.36 2011 1.36 Significance of Change No significant fluctuation, indicating a stable liquidity position (based on this measure of liquidity) (b) Compare the year 2011 financial ratios computed for Lakeside above to the industry average ratios included in Exhibit 3-3. Comment on any large fluctuations, unusual fluctuations, or lack of expected fluctuations. Also, give an overall conclusion as to the significance of the difference between Lakeside's liquidity, solvency, and profitability positions in 2011 and the industry average positions. Use the following format for your answers. Ratio Current Industry Ave. 2.16 Lakeside 2011 1.36 Significance of Change Lakeside is below the industry average. This may indicate short-term solvency problems (c) Scan each of the financial statements and the trial balances included in Exhibits 3-4 through 3-7. Comment on any unusual accounts; account balances; or large, unusual, or lack of expected fluctuations from the previous year. You should find at least 10 items. Organize your answer as follows: 21 Procedure Scan the trial balances Findings A debit balance appears in the "Allowance for Doubtful Accounts account. [Note: you may have more than one "finding" for each procedure). Significance Bad accounts may be increasing or a debit entry may have been misposted. Exhibit 3-2 Some Common Financial Ratios Ratio Current Ratio Category Liquidity Liquidity Days to Sell Inventory Liquidity Average Collection Period Debt-to-Total Assets Ratio Solvency Computation Significance Current Assets Measures the short-term debt Current Liabilities paying ability 365 Measures the average (Cost of Goods Sold / number of days' worth of Inventory inventory that is maintained 365 Measures the average [Net Sales / Net number of days to collect Receivables customer accounts Total Liabilities Measures the percentage of Total Assets a company's assets financed by creditors Measures the ability to meet Expense + Interest interest payments from Expensel operating income Interest Expense Net Income Measures the profit Net Sales generated by each dollar of sales Net Income Measures the return Total Assets generated by each dollar of asset invested by the company Net Income Measures the return Total Equity generated by each dollar invested by the owners earned Profit Margin Profitability Return on Assets Profitability Return on Equity Profitability The denominators of these ratios are typically computed as an average balance for the period; however, the ending balance for the period is used in this case, since only two years of information are given. Exhibit 3-3 Industry Average Ratios Consumer Electronics Stores LIQUIDITY: Current Ratio Average Collection Period (Days) Days to Sell Inventory 2.16 to 1 15 days 69 days PROFITABILITY: Net Profit Margin Return on Assets Return on Equity 4.2% 8.1% 19.3% LEVERAGE Times Interest Earned Debt-to-Total Assets 9.16 times 52.0% Note: These ratios represent the industry averages for following four companies (ticker symbols) in the consumer electronics industry: Best Buy (BBY), Conns, Inc. (CONN). GameStop (GME), and RadioShack (RSH). The ratios were computed from financial statement data in 2009, the most recent year available at the time of publication. More recent data on some of these ratios can be computed from Yahool Finance (http://finance.yahoo.com). Exhibit 3-4 Lakeside Company INCOME STATEMENT For Year Ending December 31, 2011 Sales Sales Returns and Discounts Net Sales Coat of Goods Sold Gross Profit Salaries, Commissions, Bonuses Advertising and Selling Expenses Rent Expense Depreciation Expense Other General and Admin. Expenses Interest Expense Income Before Income Taxes Income Taxes Net Income Retained Earnings, January 1, 2011 Cash Dividends Retained Earnings, December 31, 2011 Company Stores $5,316,000 (336,000) 4,980,000 (3,216,000) 1,764,000 (1,282,000) (178,000) (242, 000) (68,000) (204,000) (140,000) (350,000) 140,000 (210,000) Distribu- torships $6,240,000 (466,000) 5,774,000 (3,654,000) 2,120,000 (760,000) (254, 000) (50,000) (24,000) (186, 000) (88,000) 758,000 (304,000) 454,000 Lakeside Totals $11,556,000 (802,000) 10, 754,000 (6,870,000) 3,884,000 (2,042,000) (432,000) (292,000) (92,000) (390,000) (228,000) 408,000 (164, 000) 244,000 514,000 (134,000) $624.000 Lakeside Company INCOME STATEMENT Por Year Ending December 31, 2010 Sales Sales Returns and Discounts Net Sales Cost of Goods Sold Gross Profit Salaries and Commissions Advertising and selling Expenses Rent Expense Depreciation Expense Other General and Admin. Expenses Interest Expense Income Before Income Taxes Income Taxes Net Income Retained Earnings, January 1, 2010 Cash Dividends Retained Earnings, December 31, 2010 Company Stores $5,052,000 (262,000) 4,790,000 (3,036,000) 1,754,000 (1,162,000) (182,000) (192,000) (66,000) (162,000) (104,000) (114,000) 46,000 (68,000) Distribu- torships $5,292,000 (388,000) 4,904,000 (3,132,000) 1,772,000 (670,000) (224,000) (36,000) (24,000) (186,000) (70,000) 562,000 (224,000) 338.000 Lakeside Totals $10,344,000 (650,000) 9,694,000 (6, 168,000) 3,526,000 (1,832,000) (406,000) (228,000) (90,000) (348,000) (174,000) 448,000 (178,000) 270,000 386,000 (142,000) $514,000 Exhibit 3-5 Lakeside Company Balance Sheet December 31, 2010 December 31, 2011 ASSETS Current Assets Cash Accounts Receivable-Distributorship Allowance for Doubtful Accounts Net Accounts Receivable Inventory (Lower of PIPO cost or market) Total Current Assets $136.000 586,000 (38,000) 548,000 1,572,000 2,256,000 $142.000 776,000 (48,000) 728,000 1,892,000 2,762,000 Land, Building, and Equipment Land Building and Equipment Accumulated Depreciation Net Land, Build, and Equipment 298,000 674,000 (286,000) 686,000 298,000 696,000 (358,000) 636,000 Intangible Assets Leasehold Improvements Accumulated Amortization Net Leasehold Improvements 416,000 (172,000) 244,000 422,000 (192,000) 230,000 Total Assets $3,186.000 $3.628.000 LIABILITIES AND STOCKHOLDERS' EQUITY Current Liabilities Notes Payable - Current Notes Payable - Trade Accounts Payable - Cypress Accrued Bp. and Taxes Payable Total Current Liabilities 40,000 1,098,000 312,000 212,000 1, 662,000 40,000 1,392,000 332,000 270,000 2,034,000 Notes Payable - Long Term 710,000 670,000 Total Liabilities 2,372,000 2,704,000 Stockholders' Equity Common Stock, 10,000 shares issued and outstanding. $1 Par Additional Paid-In Capital Retained Earnings 20,000 280,000 514,000 20,000 280,000 624,000 Total stockholders' Equity 814.000 924,000 Total Stockholders' Equity and Liabilities 2.185.000 3.628.000 chibit 3-6 Lakeside Company Statement of Cash Flows Year Ended December 31, 2010 2011 Cash Flows from Operating Activities Cash Received from Customers Cash Paid to Suppliers Cash Paid for Selling Expenses Cash Paid for G&A Expenses Cash Paid for Interest Cash Paid for Taxes Net Cash Inflow from Operating Activities $9,622,000 (6,032, 000) (406,000) (2,554,000) (174,000) 0172.000). 284,000 $10,574,000 (6,876, 000) (432,000) (2,686,000) (228,000) 144.000) 208,000 Cash Flows from Investing Activities Purchased Land, Building and Equipment Purchased Leasehold Improvements Net Cash Outflow for Investing Activities (64,000) (34.000) (98,000) (22,000) (6.000). (28,000) Cash Flow from Financing Activities Payment on Current Notes Payable Paid Cash Dividends Net Cash Outflow for Financing Activities (40,000) (142.000) (182,000) (40,000) (134.000) (174,000) Net Increase in Cash Cash Balance at the Beginning of the Year Cash Balance at the End of the Year 4,000 132.000 $136.000 6,000 236.000 $142.000 Schedule of Noncash Investing and Financing Activities: Note Payable Issued to construct a New Store $308.000 Exhibit 3-7 Lakeside Company Trial Balance (Prepared by Client) For the Nine Months Ended September 30, 2011 and 2012 Sept. 30, 2011 Debit Credit $57,200 Sept. 30, 2012 Debit Credit $52,400 Acct. Numbers 100-1 100-2 100-3 101-1 101-2 102-1 103-1 103-2 103-3 103-4 75,000 658,600 16,800 1,285,000 66,600 45,400 79,600 34,200 69,800 43,800 298,000 327,000 256,800 85,000 854.800 8.600 1,524,400 77,600 68,800 120,000 49,200 68,200 49,800 298,000 327,000 256,800 103-6 110-1 111-1 111-6 112-1 112-6 115-1 116-1 120-1 121-1 125-1 226,000 59,200 251, 200 70, 800 57,200 62,200 24,400 33,200 54,400 54,400 36,200 45,000 422,000 422,000 126-1 200-1 200-1 Account Titles Cash - General Cash - Payroll Caah - Restricted Receivables - Distributorship Allowance for Doubtful Acets. Inventory - Warehouse Inventory - Store 1 Invento Inventory - Store 2 Inventory - Store 3 Inventory - Store 4 Inventory - Store 5 Inventory - Store 6 Land Building - Warehouse/Office Building - Store 6 Acc. Dep. - Warehouse/Office Acc. Dep. - Store 6 Equipment o. Dep. - Equipment Trucks and Vehicles Acc. Dep. - Trucks & Vehicles Leasehold Improvements Acc. Amort.- Leasehold Improve Bank Credit Line - Federal Pirst Bank Bank Credit Line - Security National Bank Accounts Payable - Cypress Accrued Expenses Payable Income Taxes Payable Payroll Taxes Payable Sales Taxes Payable Estimated Bonus Liability Notes Payable - Current Notes Payable - Long-Term Common Stock Additional Paid-In-Capital Retained Rarnings Dividends Sales - Store 1 Sales - Store 2 Sales - Store 3 Sales - Store 4 Sales - Store 5 Sales - Store 6 Sales - District A Sales - District B 188,000 836,200 648,200 323,200 210,000 823,600 756,200 413,400 210-1 220-1 220-2 220-3 220-4 230-1 240-1 240-2 300-1 310-1 400-1 410-1 500-1 500-2 500-3 500-4 500-5 500-6 510-1 510-2 8,200 37,200 12,000 40,000 680,000 20,000 280,000 514,000 12,400 40,400 39,000 40,000 780,000 20,000 280,000 624,000 97,400 62,800 547,000 795,600 472,200 484,600 746,000 221,600 648,400 829,600 639,800 797.800 917,600 530, 800 729, 200 242,400 736,200 888,000 -Ico Mect. be 510-) 510-4 510-5 510-6 520-1 520-2 550-1 550-2 550-3 550-4 550-6 555-1 580-1 S80- 580-4 Sept.30. 2011 Debit 785,000 661,600 677.600 848,800 200.000 311.400 31.200 325, 200 470.600 276.400 274,400 450.000 136,200 2,576,800 90.000 118.400 78.500 77,200 109,600 64,600 12,000 37,200 47,800 45,200 38.000 39,000 40.800 550, 800 81,400 133,400 18,200 132,400 39.600 210, 400 35,200 12,200 Sept.10.2012 Det Credit 831,400 809,600 690.600 939,800 346,800 464.000 29,600 370,600 456.800 462,000 304,000 436,000 147.600 2,818,200 102,400 118,600 80, 800 82,400 110,200 64,400 39,000 41,800 50.800 47,200 54,000 38.800 53,200 507,200 09.00 128, 400 15,000 149,800 50, 500 229,400 31, 200 9.400 580-6 Accountries Sales - District C Sales - District D Sales - District E Sales - District 7 Sales Retur - Stores Sales Returns -Distributorship Discount - Distributorship Cost of Goods Sold - Store 1 Cost of Gooda Sold - Store 2 Cost of Goods Sold - Store 3 Coat of Goods Sold - Store 4 Coat of Goods Sold - Store 5 Cost of Goods Sold - Store Cost of Goods Sold-Distributor Salary Expense Store 1 Salary Expense - Store 2 Salary Expense - store ) Salary Expense - Store 4 Salary xpense - Store 5 Salary Expense - store 6 Estimated Bonus Expense Sales Commissions - District A Sales Commissions - District B Sales Commissions - District C Sales Comisione - District D Sales Comissions - District E Sales Commissions - District ? Admin And Warehouse Salaries Payroll Taxes Expense Advertising Expense - Stores Advertising Rp - Distributor Travel xpenses - Salesmen Freight-Out Rent Expense - Stores Rent Expense - Vehicles Rent Expense - Equipment Intracompany Rent - Store 6 Depreciation Expense Computer Accounting Services Legal and Auditing Expenses Nepair and Maintenance Supplies Expense Utilities Expense Bad Debt wense Property Tax pense Other Miscellaneous penses Interest pense Tncome Tax Expense Gain on sale of Pixed Asset TOTALS 590-1 590-2 590-) 590-6 595-1 590-1 600.1 600-2 605-1 610-1 615-1 615-3 620-1 625-1 630-1 640-1 645-1 75,800 20,400 21,400 38,200 10,200 39,200 76,000 25,200 18,200 97.100 0.600 72,800 670-1 680-1 26.200 79, 800 162,400 150.000 42,200 67,200 278,200 184,000 300-1 S11.591.50 S11.591.50 13.24.200 13.244.200Step by Step Solution
There are 3 Steps involved in it
Step: 1

Get Instant Access to Expert-Tailored Solutions
See step-by-step solutions with expert insights and AI powered tools for academic success
Step: 2

Step: 3

Ace Your Homework with AI
Get the answers you need in no time with our AI-driven, step-by-step assistance
Get Started


