Answered step by step
Verified Expert Solution
Question
1 Approved Answer
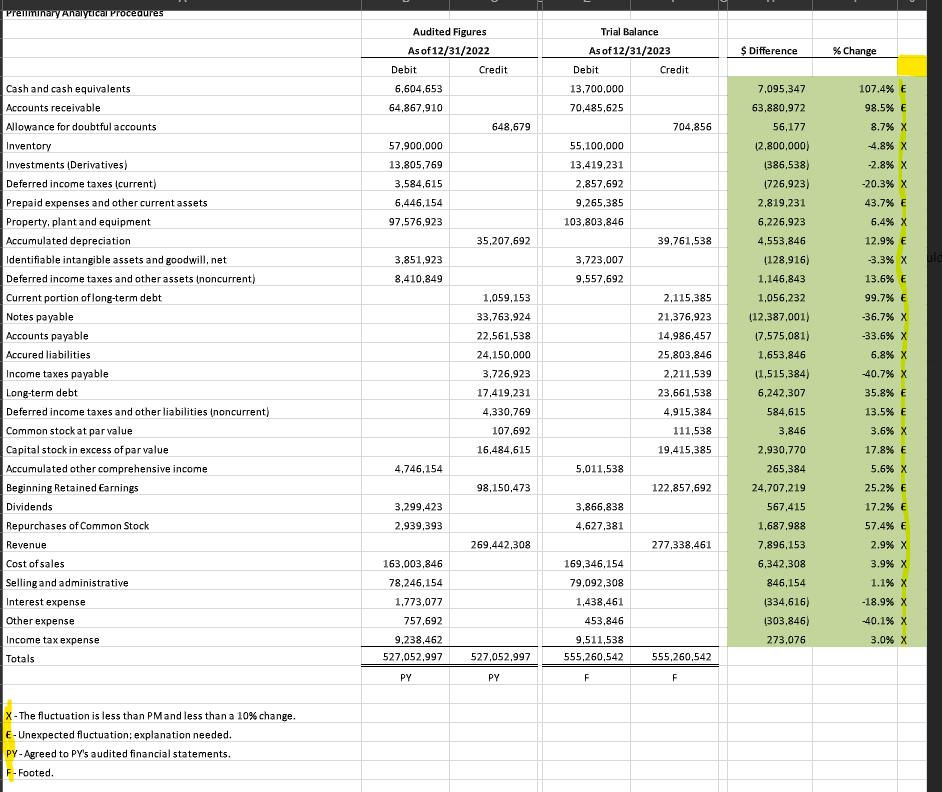
Preliminary Analytical Procedures Audited Figures Trial Balance As of 12/31/2022 As of 12/31/2023 $ Difference % Change Cash and cash equivalents Accounts receivable Allowance

Preliminary Analytical Procedures Audited Figures Trial Balance As of 12/31/2022 As of 12/31/2023 $ Difference % Change Cash and cash equivalents Accounts receivable Allowance for doubtful accounts Inventory Investments (Derivatives) Debit 6,604,653 Credit Debit Credit 13,700,000 64,867,910 70,485,625 7,095,347 63,880,972 107.4% E 98.5% E 648,679 704,856 57,900,000 55,100,000 56,177 (2,800,000) 8.7% X -4.8% X 13,805,769 13,419,231 (386,538) -2.8% X Deferred income taxes (current) 3,584,615 2,857,692 (726,923) -20.3% X Prepaid expenses and other current assets 6,446,154 9,265,385 2,819,231 43.7% E Property, plant and equipment 97,576,923 103,803,846 6,226,923 6.4% X Accumulated depreciation 35,207,692 39,761,538 4,553,846 12.9% E Identifiable intangible assets and goodwill, net 3,851,923 Deferred income taxes and other assets (noncurrent) 8,410,849 3,723,007 9,557,692 (128,916) -3.3% X ald 1,146,843 13.6% E Current portion of long-term debt 1,059,153 2,115,385 1,056,232 99.7% E Notes payable 33,763,924 21,376,923 (12,387,001) -36.7% X Accounts payable Accured liabilities Income taxes payable Long-term debt 22,561,538 24,150,000 3,726,923 17,419,231 Deferred income taxes and other liabilities (noncurrent) Common stock at par value Capital stock in excess of par value Accumulated other comprehensive income 4,330,769 107,692 16,484,615 14,986,457 25,803,846 2,211,539 23,661,538 4,915,384 111,538 19,415,385 (7,575,081) -33.6% X 1,653,846 (1,515,384) 6.8% X -40.7% X 6,242,307 35.8% E 584,615 13.5% E 3,846 3.6% X 4,746,154 5,011,538 2,930,770 265,384 17.8% E 5.6% X Beginning Retained Earnings 98,150,473 122,857,692 24,707,219 25.2% E Dividends Repurchases of Common Stock Revenue Cost of sales Selling and administrative Interest expense 3,299,423 2,939,393 3,866,838 4,627,381 567,415 17.2% E 1,687,988 57.4% 269,442,308 277,338,461 7,896,153 2.9% X 163,003,846 78,246,154 169,346,154 6,342,308 3.9% X 79,092,308 846,154 1.1% X Other expense Income tax expense Totals 1,773,077 757,692 1,438,461 (334,616) -18.9% X 453,846 (303,846) -40.1% X 9,238,462 527,052,997 527,052,997 9,511,538 555,260,542 273,076 3.0% X 555,260,542 PY PY F F X-The fluctuation is less than PM and less than a 10% change. E-Unexpected fluctuation; explanation needed. PY-Agreed to PY's audited financial statements. F-Footed.
Step by Step Solution
There are 3 Steps involved in it
Step: 1
Based on the provided audited figures and trial balance for the years 2022 and 2023 here is a summar...
Get Instant Access to Expert-Tailored Solutions
See step-by-step solutions with expert insights and AI powered tools for academic success
Step: 2

Step: 3

Ace Your Homework with AI
Get the answers you need in no time with our AI-driven, step-by-step assistance
Get Started


