

Answered step by step
Verified Expert Solution
Question
1 Approved Answer
Prepare a cash flow statement basis the IS and BS provided. Cash flow statement for financial year 2019, 2020 and 2021 required. Profitability Statement Year
Prepare a cash flow statement basis the IS and BS provided.
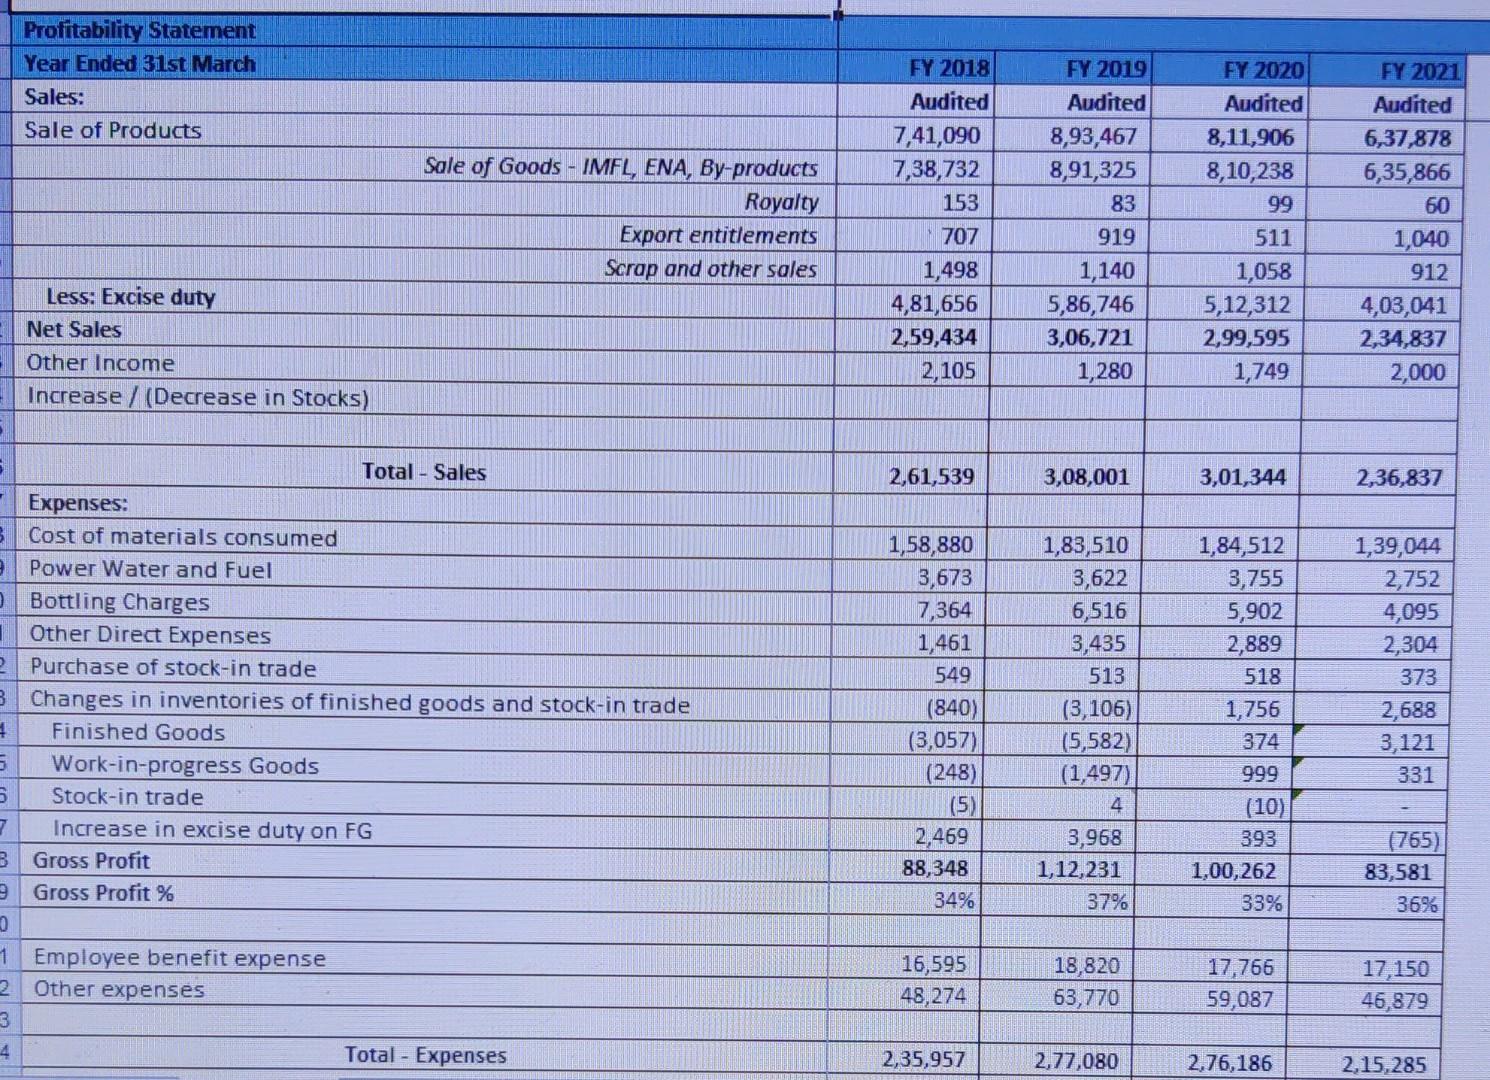
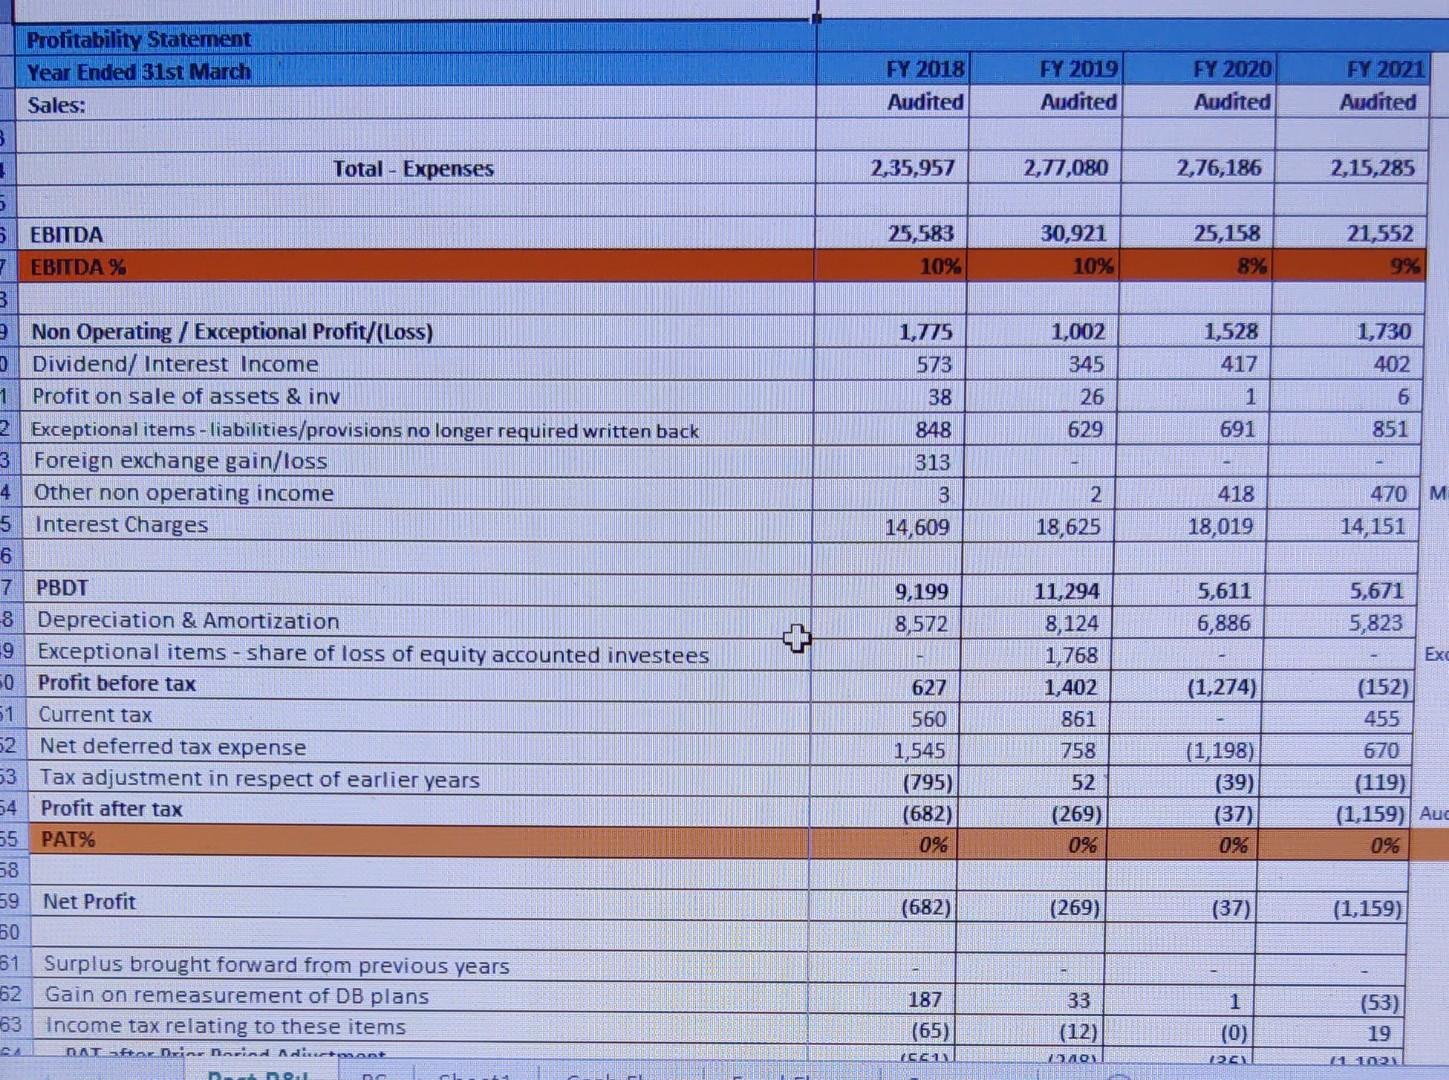
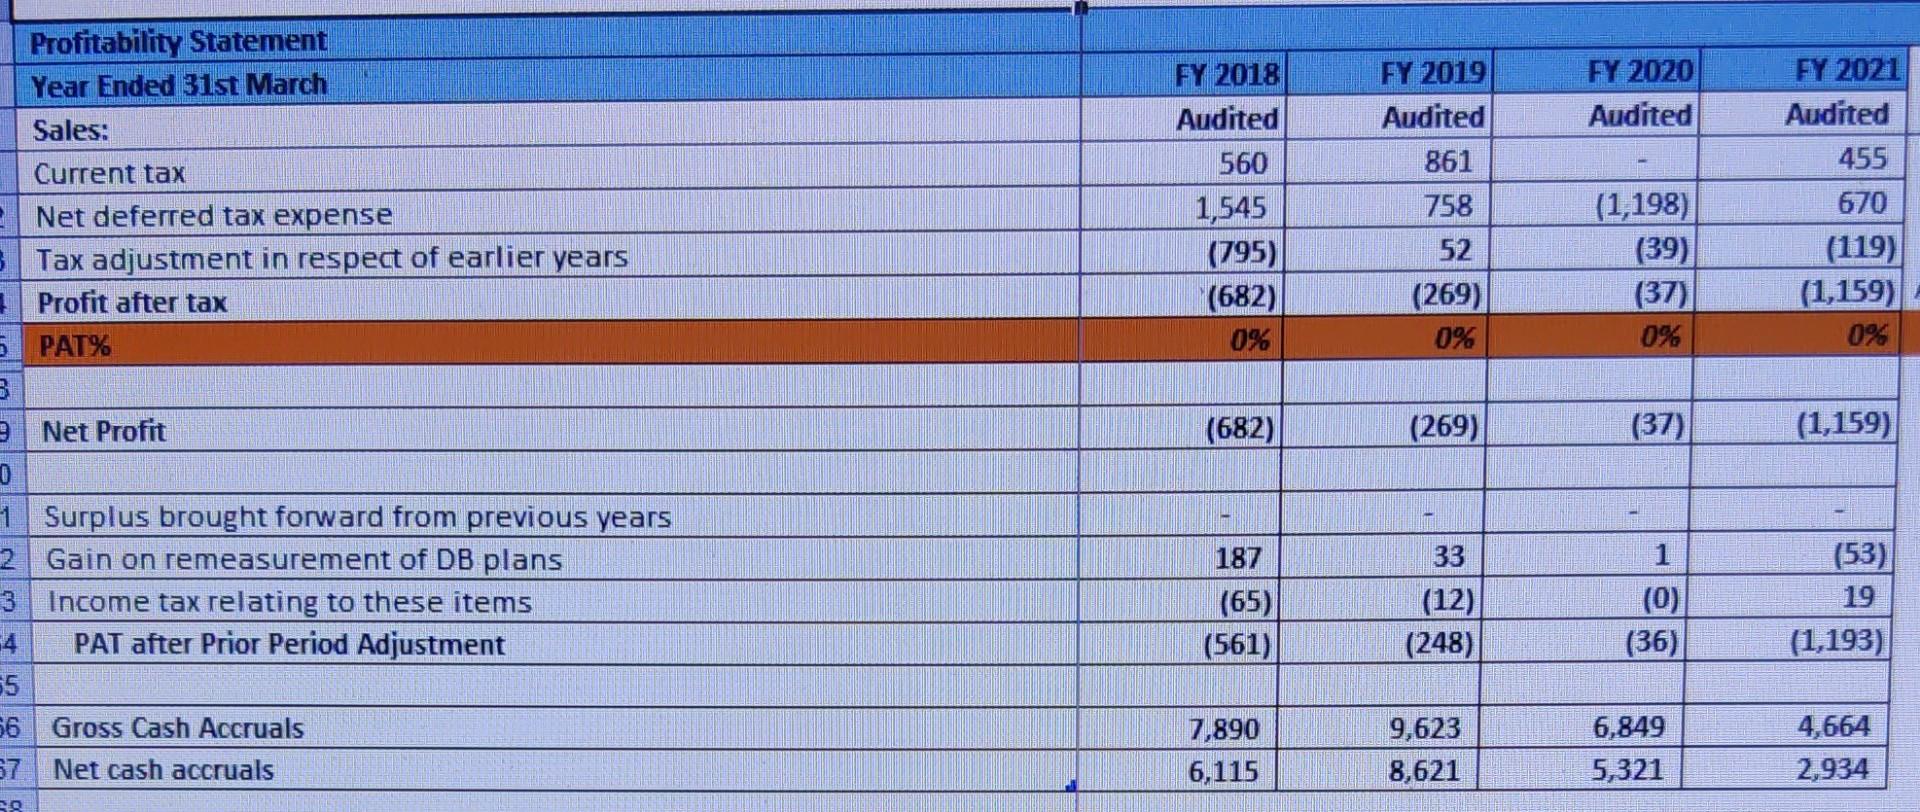
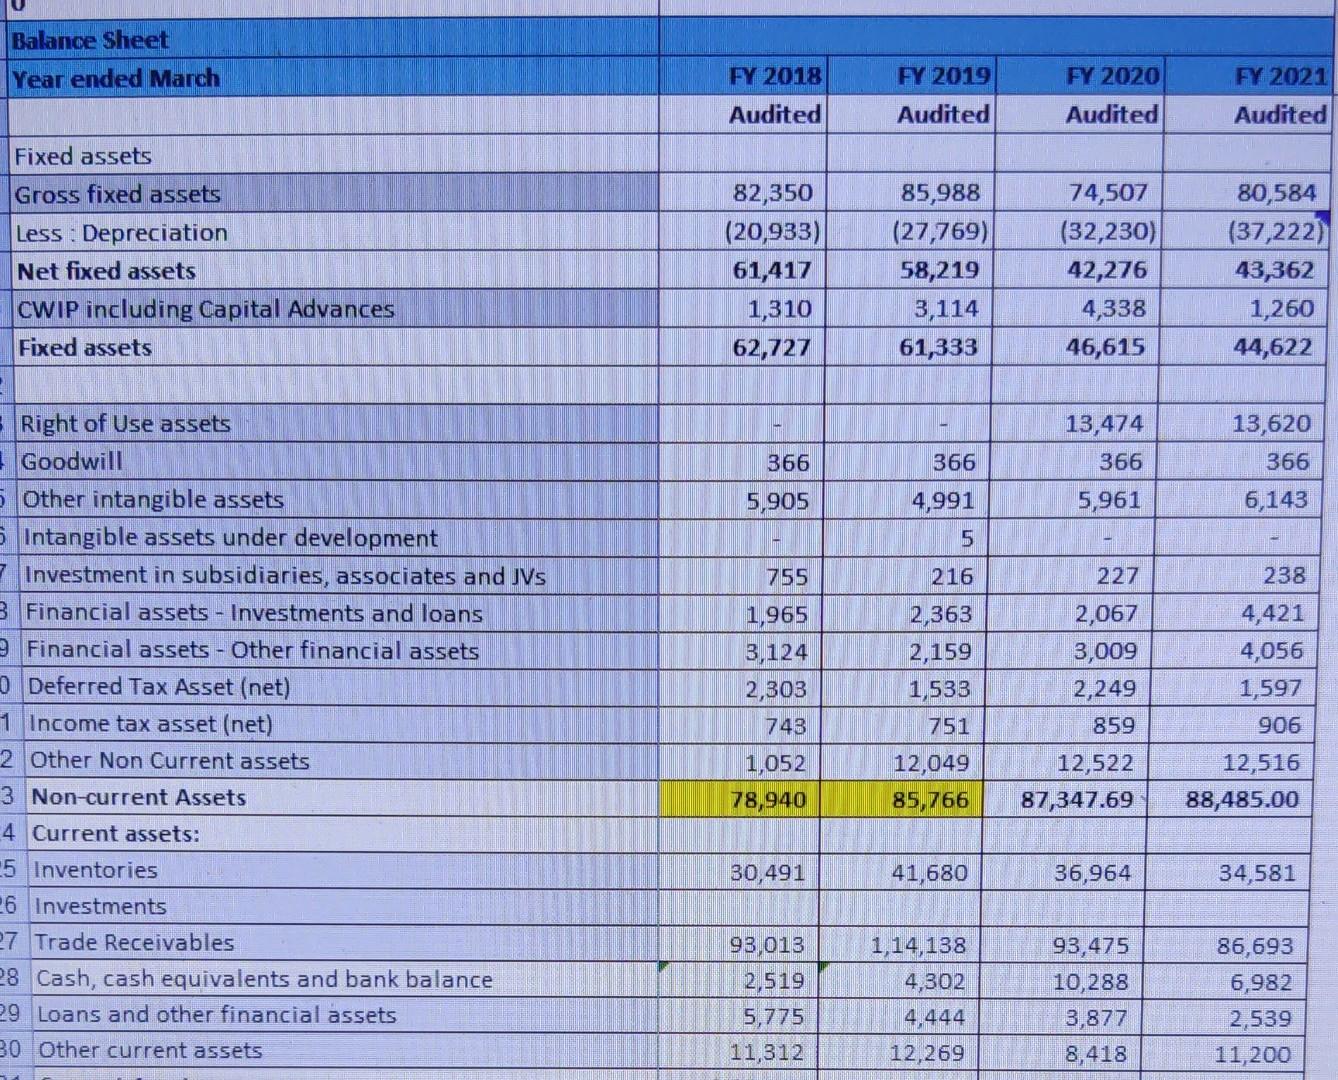
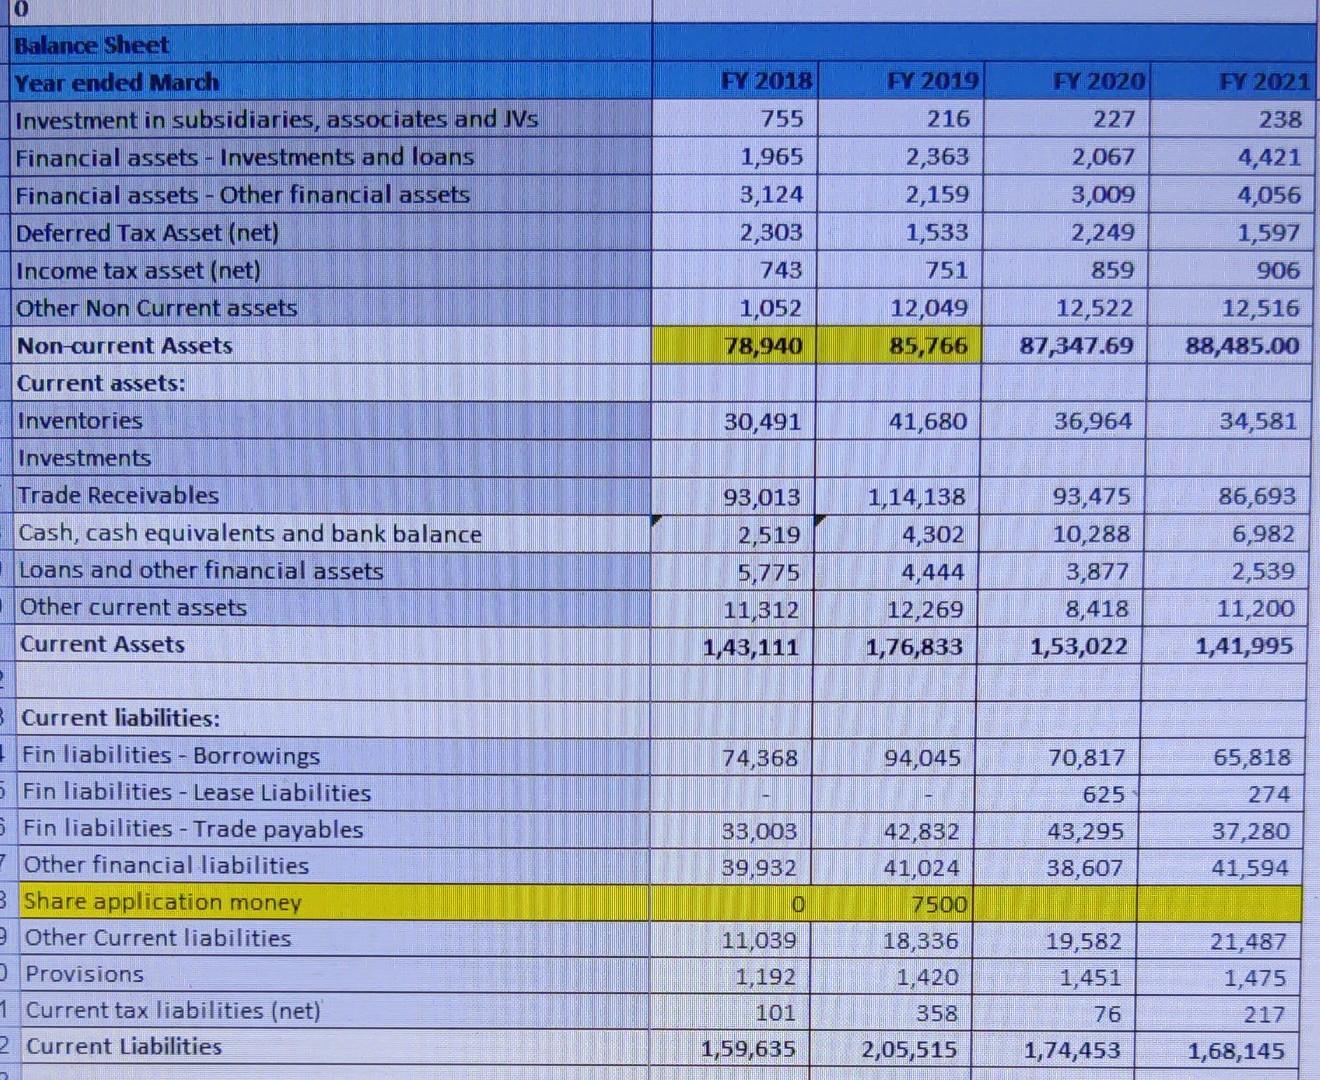
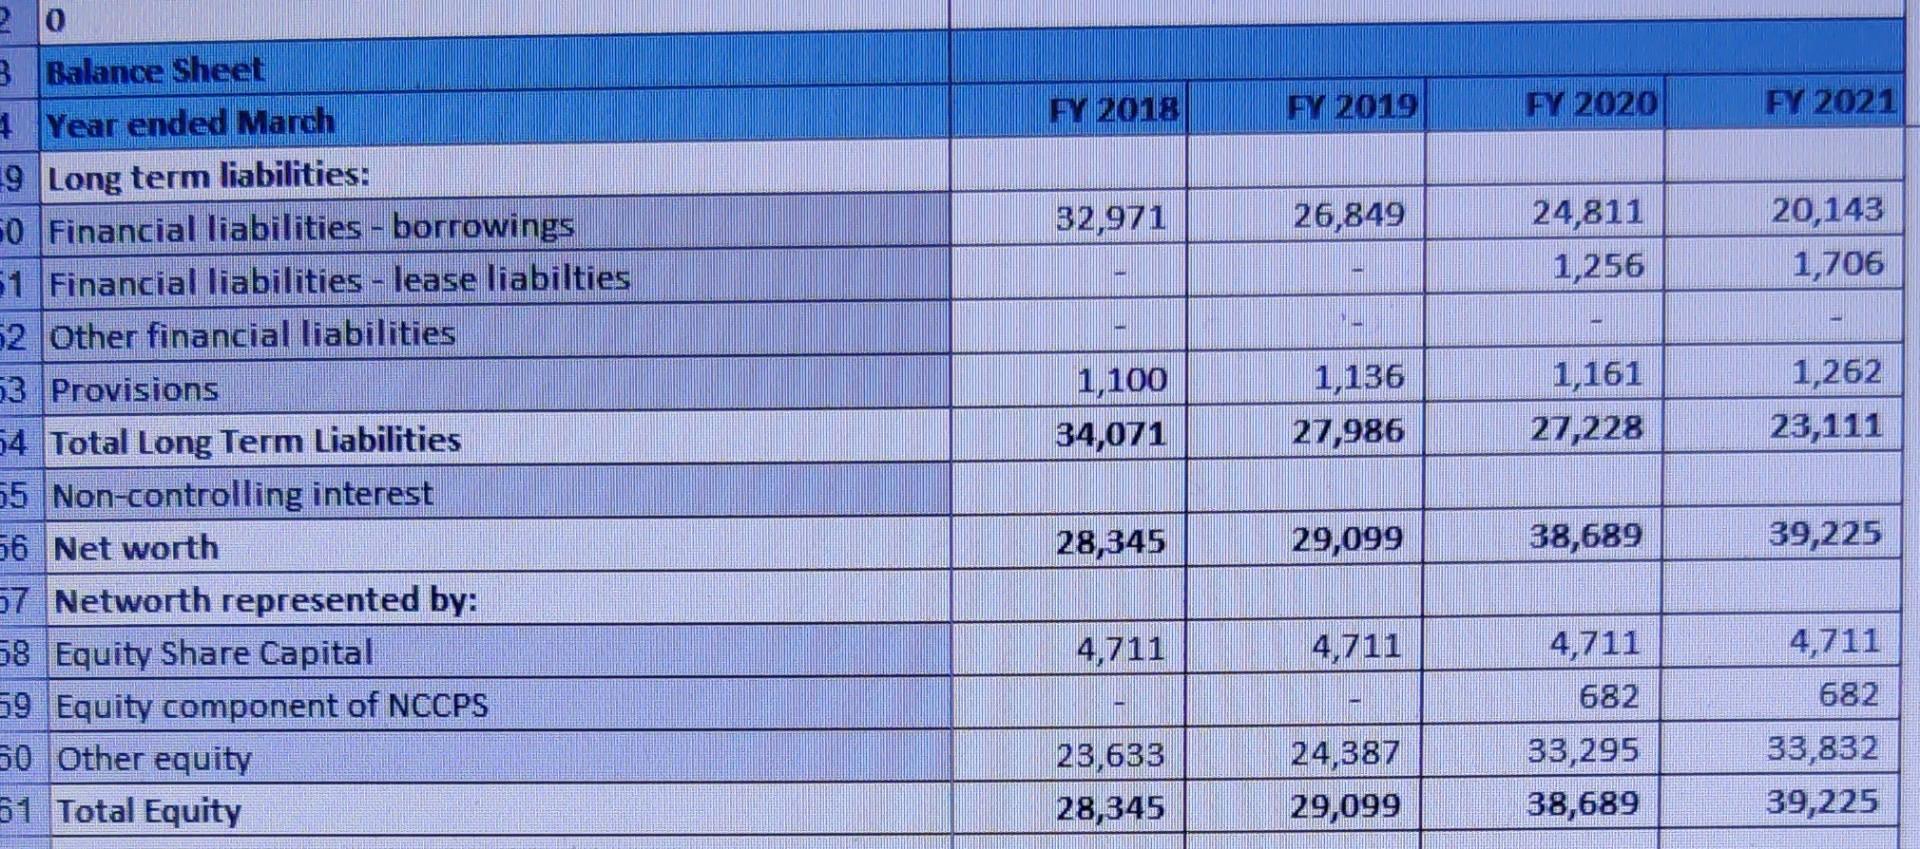
Cash flow statement for financial year 2019, 2020 and 2021 required.
Profitability Statement Year Ended 31st March Sales: Sale of Products Sale of Goods - IMFL, ENA, By-products Royalty Export entitlements Scrap and other sales FY 2018 Audited 7,41,090 7,38,732 153 707 1,498 4,81,656 2,59,434 2,105 FY 2019 Audited 8,93,467 8,91,325 83 919 1,140 5,86,746 3,06,721 1,280 FY 2020 Audited 8,11,906 8,10,238 99 511 1,058 5,12,312 2,99,595 1,749 FY 2021 Audited 6,37,878 6,35,866 60 1,040 912 4,03,041 2,34,837 2,000 Less: Excise duty Net Sales Other Income Increase / (Decrease in Stocks) 2,61,539 3,08,001 3,01,344 2,36,837 Total - Sales Expenses: 3 Cost of materials consumed Power Water and Fuel Bottling Charges Other Direct Expenses Purchase of stock-in trade 3 Changes in inventories of finished goods and stock-in trade Finished Goods 5 Work-in-progress Goods 5 Stock-in trade 7 Increase in excise duty on FG B Gross Profit 3 Gross Profit % 1,58,880 3,673 7,364 1,461 549 (840) (3,057) (248) (5) 2,469 88,348 34% 1,83,510 3,622 6,516 3,435 513 (3,106) (5,582) (1,497) 4 3,968 1,12,231 37% 1,84,512 3,755 5,902 2,889 518 1,756 374 999 (10) 393 1,00,262 33% 1,39,044 2,752 4,095 2,304 373 2,688 3,121 331 (765) 83,581 36% 1 Employee benefit expense Other expenses 2 16,595 48,274 18,820 63,770 17,766 59,087 17,150 46,879 3 4 Total - Expenses 2,35,957 2,77,080 2,76,186 2,15,285 Profitability Statement Year Ended 31st March Sales: FY 2018 Audited FY 2019 Audited FY 2020 Audited FY 2021 Audited Total - Expenses 2,35,957 2,77,080 2,76,186 2,15,285 25,583 10% 30,921 10% 25,158 8% 21,552 9% 1,730 1,775 573 1,002 345 1,528 417 38 1 26 629 402 6 851 691 848 313 418 3 14,609 2 18,625 470 M 14,151 18,019 9,199 8,572 5,611 6,886 5,671 5,823 5. EBITDA 7 EBITDA % 3 3 Non Operating / Exceptional Profit/(Loss) Dividend/ Interest Income 1 Profit on sale of assets & inv 2 Exceptional items - liabilities/provisions no longer required written back 3 Foreign exchange gain/loss 4 Other non operating income 5 Interest Charges 6 7 PBDT 8 Depreciation & Amortization 9 Exceptional items - share of loss of equity accounted investees 50 Profit before tax 51 Current tax 52 Net deferred tax expense 53 Tax adjustment in respect of earlier years 54 Profit after tax 65 PAT% 58 59 Net Profit 60 61 Surplus brought forward from previous years 62 Gain on remeasurement of DB plans 63 income tax relating to these items DAT For Drier Tarind Adiertoont 11,294 8,124 1,768 1,402 861 Exc (1,274) 627 560 1,545 (795) 758 (152) 455 670 (119) (1,159) Auc 09 (1,198) (39) (37) (682) 0% 52 (269) 0% 0% (682) (269) (37) (1,159) 187 (65) ACCUNI 33 (12) 1 (0) PEN (53) 19 1 FY 2020 Audited FY 2018 Audited 560 1,545 (795) (682) 0% FY 2019 Audited 861 758 52 (269) 0% (1,198) (39) (37) FY 2021 Audited 455 670 (119) (1,159) 0% 0% Profitability Statement Year Ended 31st March Sales: Current tax 2 Net deferred tax expense 3 Tax adjustment in respect of earlier years Profit after tax PAT% 3. 2 Net Profit 0 1 Surplus brought forward from previous years 2 Gain on remeasurement of DB plans 3 | Income tax relating to these items PAT after Prior Period Adjustment 55 S6 Gross Cash Accruals 67 Net cash accruals (682) (269) (37) (1,159) 187 (65) (561) 33 (12) (248) 1 (0) (36) (53) 19 (1,193) 7,890 6,115 9,623 8,621 6,849 5,321 4,664 2,934 o Balance Sheet Year ended March FY 2018 FY 2019 FY 2020 FY 2021 Audited Audited Audited Audited Fixed assets Gross fixed assets Less : Depreciation Net fixed assets CWIP including Capital Advances Fixed assets 82,350 (20,933) 61,417 1,310 62,727 85,988 (27,769) 58,219 3,114 61,333 74,507 (32,230) 42,276 4,338 46,615 80,584 (37,222) 43,362 1,260 44,622 13,474 366 366 366 13,620 366 6,143 5,905 5,961 4,991 5 755 216 227 238 Right of Use assets Goodwill 5 Other intangible assets Intangible assets under development 7 Investment in subsidiaries, associates and is B Financial assets - Investments and loans Financial assets - Other financial assets Deferred Tax Asset (net) 1 Income tax asset (net) 2 Other Non Current assets 3 Non-current Assets 4 Current assets: 5 Inventories 26 Investments 27 Trade Receivables 28 Cash, cash equivalents and bank balance 29 Loans and other financial assets 30 Other current assets 1,965 3,124 2,303 743 2,363 2,159 1,533 751 2,067 3,009 2,249 859 12,522 87,347.69 4,421 4,056 1,597 906 12,516 88,485.00 1,052 78,940 12,049 85,766 30,491 41,680 36,964 34,581 93,013 2,519 5,775 11,312 1,14,138 4,302 4.444 12,269 93,475 10,288 3,877 8,418 86,693 6,982 2,539 11,200 FY 2018 FY 2019 FY 2020 FY 2021 227 238 0 Balance Sheet Year ended March Investment in subsidiaries, associates and JVs Financial assets - Investments and loans Financial assets - Other financial assets Deferred Tax Asset (net) Income tax asset (net) Other Non Current assets Non-current Assets 755 1,965 3,124 2,303 743 1,052 78,940 216 2,363 2,159 1,533 751 2,067 3,009 2,249 859 12,522 87,347.69 4,421 4,056 1,597 906 12,516 88,485.00 12,049 85,766 Current assets: Inventories 30,491 41,680 36,964 34,581 Investments Trade Receivables Cash, cash equivalents and bank balance Loans and other financial assets 93,013 2,519 5,775 11,312 1,43,111 1,14,138 4,302 4,444 12,269 1,76,833 93,475 10,288 3,877 8,418 1,53,022 86,693 6,982 2,539 11,200 1,41,995 Other current assets Current Assets 94,045 70,817 65,818 625 274 Current liabilities: Fin liabilities - Borrowings 5 Fin liabilities - Lease Liabilities 5 Fin liabilities - Trade payables 7 Other financial liabilities 3 Share application money 2 Other Current liabilities Provisions 1 Current tax liabilities (net) 2 Current Liabilities 74,368 |- 33,003 39,932 42,832 43,295 38,607 37,280 41,594 0 41,024 7500 18,336 1,420 358 19,582 11,039 1,192 101 21.487 1,475 1,451 76 217 1,59,635 2,05,515 1,74,453 1,68,145 FY 2018 PY 2019 PY 2020 FV 2021 32,971 26,849 24,811 1,256 20,143 1,706 20 3 Balance Sheet 2 Year ended March 19 Long term liabilities: 50 Financial liabilities - borrowings 51 Financial liabilities - lease liabilties 52 Other financial liabilities 53 Provisions 54 Total Long Term Liabilities 55 Non-controlling interest 56 Net worth 7 Networth represented by: 58 Equity Share Capital 59 Equity component of NCCPS 50 Other equity 51 Total Equity 1,100 34,071 1,136 27,986 1,161 27,228 1,262 23,111 28,345 29,099 38,689 39,225 4,711 4,711 4,711 4,711 682 682 23,633 24,387 29,099 33,295 38,689 33,832 39,225 28,345 Profitability Statement Year Ended 31st March Sales: Sale of Products Sale of Goods - IMFL, ENA, By-products Royalty Export entitlements Scrap and other sales FY 2018 Audited 7,41,090 7,38,732 153 707 1,498 4,81,656 2,59,434 2,105 FY 2019 Audited 8,93,467 8,91,325 83 919 1,140 5,86,746 3,06,721 1,280 FY 2020 Audited 8,11,906 8,10,238 99 511 1,058 5,12,312 2,99,595 1,749 FY 2021 Audited 6,37,878 6,35,866 60 1,040 912 4,03,041 2,34,837 2,000 Less: Excise duty Net Sales Other Income Increase / (Decrease in Stocks) 2,61,539 3,08,001 3,01,344 2,36,837 Total - Sales Expenses: 3 Cost of materials consumed Power Water and Fuel Bottling Charges Other Direct Expenses Purchase of stock-in trade 3 Changes in inventories of finished goods and stock-in trade Finished Goods 5 Work-in-progress Goods 5 Stock-in trade 7 Increase in excise duty on FG B Gross Profit 3 Gross Profit % 1,58,880 3,673 7,364 1,461 549 (840) (3,057) (248) (5) 2,469 88,348 34% 1,83,510 3,622 6,516 3,435 513 (3,106) (5,582) (1,497) 4 3,968 1,12,231 37% 1,84,512 3,755 5,902 2,889 518 1,756 374 999 (10) 393 1,00,262 33% 1,39,044 2,752 4,095 2,304 373 2,688 3,121 331 (765) 83,581 36% 1 Employee benefit expense Other expenses 2 16,595 48,274 18,820 63,770 17,766 59,087 17,150 46,879 3 4 Total - Expenses 2,35,957 2,77,080 2,76,186 2,15,285 Profitability Statement Year Ended 31st March Sales: FY 2018 Audited FY 2019 Audited FY 2020 Audited FY 2021 Audited Total - Expenses 2,35,957 2,77,080 2,76,186 2,15,285 25,583 10% 30,921 10% 25,158 8% 21,552 9% 1,730 1,775 573 1,002 345 1,528 417 38 1 26 629 402 6 851 691 848 313 418 3 14,609 2 18,625 470 M 14,151 18,019 9,199 8,572 5,611 6,886 5,671 5,823 5. EBITDA 7 EBITDA % 3 3 Non Operating / Exceptional Profit/(Loss) Dividend/ Interest Income 1 Profit on sale of assets & inv 2 Exceptional items - liabilities/provisions no longer required written back 3 Foreign exchange gain/loss 4 Other non operating income 5 Interest Charges 6 7 PBDT 8 Depreciation & Amortization 9 Exceptional items - share of loss of equity accounted investees 50 Profit before tax 51 Current tax 52 Net deferred tax expense 53 Tax adjustment in respect of earlier years 54 Profit after tax 65 PAT% 58 59 Net Profit 60 61 Surplus brought forward from previous years 62 Gain on remeasurement of DB plans 63 income tax relating to these items DAT For Drier Tarind Adiertoont 11,294 8,124 1,768 1,402 861 Exc (1,274) 627 560 1,545 (795) 758 (152) 455 670 (119) (1,159) Auc 09 (1,198) (39) (37) (682) 0% 52 (269) 0% 0% (682) (269) (37) (1,159) 187 (65) ACCUNI 33 (12) 1 (0) PEN (53) 19 1 FY 2020 Audited FY 2018 Audited 560 1,545 (795) (682) 0% FY 2019 Audited 861 758 52 (269) 0% (1,198) (39) (37) FY 2021 Audited 455 670 (119) (1,159) 0% 0% Profitability Statement Year Ended 31st March Sales: Current tax 2 Net deferred tax expense 3 Tax adjustment in respect of earlier years Profit after tax PAT% 3. 2 Net Profit 0 1 Surplus brought forward from previous years 2 Gain on remeasurement of DB plans 3 | Income tax relating to these items PAT after Prior Period Adjustment 55 S6 Gross Cash Accruals 67 Net cash accruals (682) (269) (37) (1,159) 187 (65) (561) 33 (12) (248) 1 (0) (36) (53) 19 (1,193) 7,890 6,115 9,623 8,621 6,849 5,321 4,664 2,934 o Balance Sheet Year ended March FY 2018 FY 2019 FY 2020 FY 2021 Audited Audited Audited Audited Fixed assets Gross fixed assets Less : Depreciation Net fixed assets CWIP including Capital Advances Fixed assets 82,350 (20,933) 61,417 1,310 62,727 85,988 (27,769) 58,219 3,114 61,333 74,507 (32,230) 42,276 4,338 46,615 80,584 (37,222) 43,362 1,260 44,622 13,474 366 366 366 13,620 366 6,143 5,905 5,961 4,991 5 755 216 227 238 Right of Use assets Goodwill 5 Other intangible assets Intangible assets under development 7 Investment in subsidiaries, associates and is B Financial assets - Investments and loans Financial assets - Other financial assets Deferred Tax Asset (net) 1 Income tax asset (net) 2 Other Non Current assets 3 Non-current Assets 4 Current assets: 5 Inventories 26 Investments 27 Trade Receivables 28 Cash, cash equivalents and bank balance 29 Loans and other financial assets 30 Other current assets 1,965 3,124 2,303 743 2,363 2,159 1,533 751 2,067 3,009 2,249 859 12,522 87,347.69 4,421 4,056 1,597 906 12,516 88,485.00 1,052 78,940 12,049 85,766 30,491 41,680 36,964 34,581 93,013 2,519 5,775 11,312 1,14,138 4,302 4.444 12,269 93,475 10,288 3,877 8,418 86,693 6,982 2,539 11,200 FY 2018 FY 2019 FY 2020 FY 2021 227 238 0 Balance Sheet Year ended March Investment in subsidiaries, associates and JVs Financial assets - Investments and loans Financial assets - Other financial assets Deferred Tax Asset (net) Income tax asset (net) Other Non Current assets Non-current Assets 755 1,965 3,124 2,303 743 1,052 78,940 216 2,363 2,159 1,533 751 2,067 3,009 2,249 859 12,522 87,347.69 4,421 4,056 1,597 906 12,516 88,485.00 12,049 85,766 Current assets: Inventories 30,491 41,680 36,964 34,581 Investments Trade Receivables Cash, cash equivalents and bank balance Loans and other financial assets 93,013 2,519 5,775 11,312 1,43,111 1,14,138 4,302 4,444 12,269 1,76,833 93,475 10,288 3,877 8,418 1,53,022 86,693 6,982 2,539 11,200 1,41,995 Other current assets Current Assets 94,045 70,817 65,818 625 274 Current liabilities: Fin liabilities - Borrowings 5 Fin liabilities - Lease Liabilities 5 Fin liabilities - Trade payables 7 Other financial liabilities 3 Share application money 2 Other Current liabilities Provisions 1 Current tax liabilities (net) 2 Current Liabilities 74,368 |- 33,003 39,932 42,832 43,295 38,607 37,280 41,594 0 41,024 7500 18,336 1,420 358 19,582 11,039 1,192 101 21.487 1,475 1,451 76 217 1,59,635 2,05,515 1,74,453 1,68,145 FY 2018 PY 2019 PY 2020 FV 2021 32,971 26,849 24,811 1,256 20,143 1,706 20 3 Balance Sheet 2 Year ended March 19 Long term liabilities: 50 Financial liabilities - borrowings 51 Financial liabilities - lease liabilties 52 Other financial liabilities 53 Provisions 54 Total Long Term Liabilities 55 Non-controlling interest 56 Net worth 7 Networth represented by: 58 Equity Share Capital 59 Equity component of NCCPS 50 Other equity 51 Total Equity 1,100 34,071 1,136 27,986 1,161 27,228 1,262 23,111 28,345 29,099 38,689 39,225 4,711 4,711 4,711 4,711 682 682 23,633 24,387 29,099 33,295 38,689 33,832 39,225 28,345Step by Step Solution
There are 3 Steps involved in it
Step: 1

Get Instant Access to Expert-Tailored Solutions
See step-by-step solutions with expert insights and AI powered tools for academic success
Step: 2

Step: 3
Ace Your Homework with AI
Get the answers you need in no time with our AI-driven, step-by-step assistance
Get Started
Multi Level Finance And The Euro Crisis Causes And Effects
Authors: Ehtisham Ahmad, Massimo BordignonA, Giorgio Brosio
1st Edition
1784715107, 978-1784715106