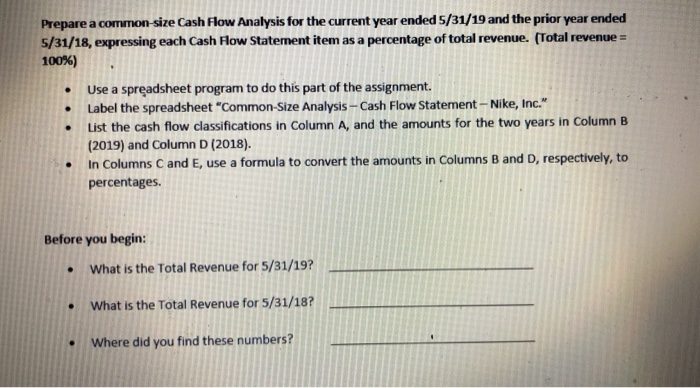
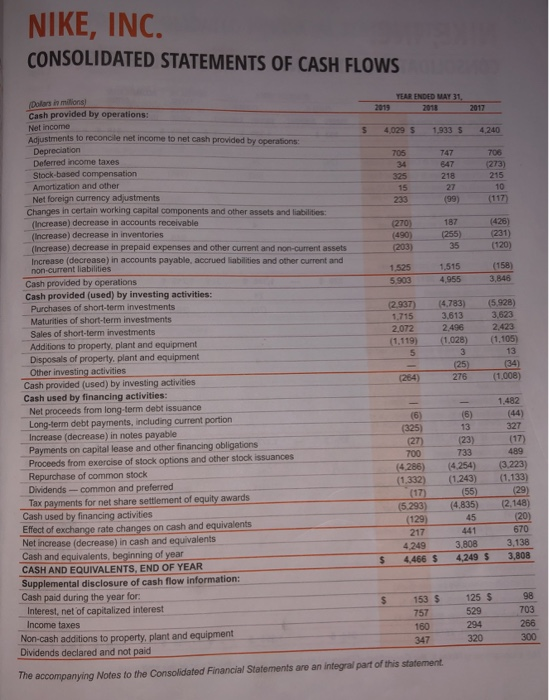
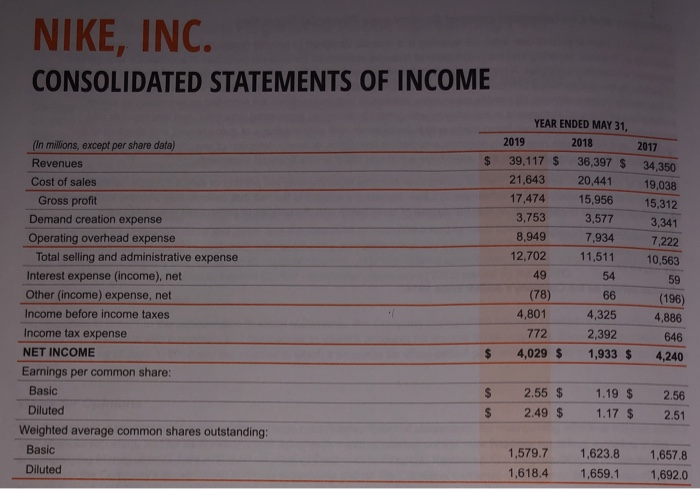
Prepare a common-size Cash Flow Analysis for the current year ended 5/31/19 and the prior year ended 5/31/18, expressing each Cash How Statement item as a percentage of total revenue. (Total revenue = 100%) Use a spreadsheet program to do this part of the assignment. Label the spreadsheet"Common-Size Analysis - Cash Flow Statement - Nike, Inc." List the cash flow classifications in Column A, and the amounts for the two years in Column B (2019) and Column D (2018). In Columns C and E, use a formula to convert the amounts in Columns B and D, respectively, to percentages. Before you begin: What is the Total Revenue for 5/31/19? What is the Total Revenue for 5/31/18? Where did you find these numbers? NIKE, INC. CONSOLIDATED STATEMENTS OF CASH FLOWS YEAR ENDED MAY 31, 2011 2017 4,029 5 1,933 5 4.240 705 747 547 706 (273) 215 325 218 233 (99) (270) (490) (203) 187 (255) (426) (231) (120) 35 1,525 5.903 1.515 4.955 (158) 3,846 (2.937) 1,715 2.072 (1.119) 5 (4.783) 3.6133 2.496 (1.028) (5.928) ,623 2.423 (1.105) Dollar in milions! Cash provided by operations: Net income Adiustments to reconcile net income to net cash provided by operations: Depreciation Deferred income taxes Stock-based compensation Amortization and other Net foreign currency adjustments Changes in certain working capital components and other assets and liabilities: Increase) decrease in accounts receivable (Increase) decrease in inventories (Increase) decrease in prepaid expenses and other current and non-current assets Increase (decrease) in accounts payable, accrued liabilities and other current and non-current liabilities Cash provided by operations Cash provided (used) by investing activities: Purchases of short-term investments Maturities of short-term investments Sales of short-term investments Additions to property, plant and equipment Disposals of property, plant and equipment Other investing activities Cash provided (used) by investing activities Cash used by financing activities: Net proceeds from long-term debt issuance Long-term debt payments, including current portion Increase (decrease) in notes payable Payments on capital lease and other financing obligations Proceeds from exercise of stock options and other stock issuances Repurchase of common stock Dividends - common and preferred Tax payments for net share settlement of equity awards Cash used by financing activities Effect of exchange rate changes on cash and equivalents Net increase (decrease) in cash and equivalents Cash and equivalents, beginning of year CASH AND EQUIVALENTS, END OF YEAR Supplemental disclosure of cash flow information: Cash paid during the year for: Interest, net of capitalized interest Income taxes Non-cash additions to property, plant and equipment Dividends declared and not paid (25) 276 (1,008) 1,482 (44) (6) 13 (23) 733 (4.254) (1.243) (325) (27) 700 (4.286) (1.332) (17) (5.293) (129) 217 4249 4,466 $ (55) (17) 489 (3.223) (1.133) (29) (2.148) (20) 670 3,138 3,808 (4.835) 45 441 3.808 4,249 $ $ $ 125 S 153 $ 757 160 98 703 529 294 320 347 300 The accompanying Notes to the Consolidated Financial Statements are an integral part of this statement NIKE, INC. CONSOLIDATED STATEMENTS OF INCOME (in millions, except per share data) Revenues Cost of sales Gross profit Demand creation expense Operating overhead expense Total selling and administrative expense Interest expense (income), net Other (income) expense, net Income before income taxes Income tax expense NET INCOME Earnings per common share: Basic Diluted Weighted average common shares outstanding: Basic Diluted YEAR ENDED MAY 31, 2019 2018 2017 39,117 $ 36,397 $ 34,350 21,643 20,441 19,038 17,474 15,956 15,312 3,753 3,577 3,341 8,949 7,934 12,702 11,511 10,563 49 54 59 (78) 66 (196) 4,801 4,325 4,886 772 2,392 6 46 4,029 $ 1,933 $ 4,240 7.222 $ $ $ 2.55 $ 2.49 $ 1.19 $ 1.17 $ 2.56 2.51 1,579.7 1,618.4 1,623.8 1,659.1 1,657.8 1,692.0


