Answered step by step
Verified Expert Solution
Question
1 Approved Answer
Prepare a fictional data set in SPSS with following variables and 72 objects Gender (Female - Male) Height (in centimeters) (Between 150 cm and


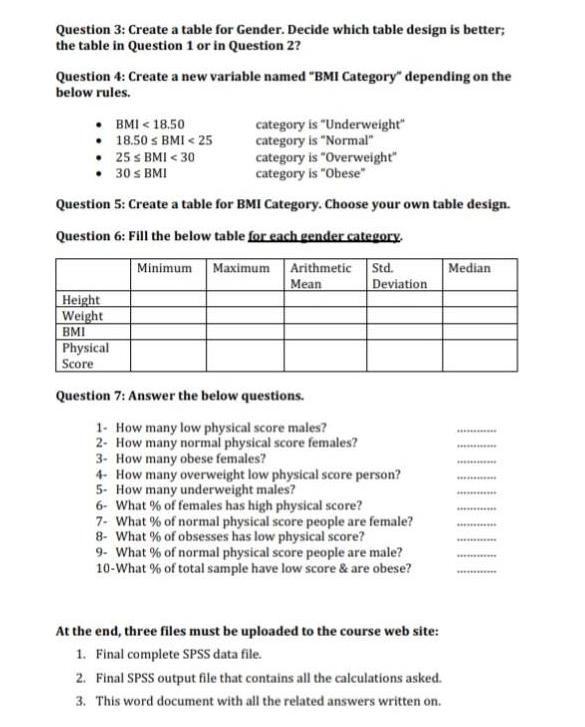
Prepare a fictional data set in SPSS with following variables and 72 objects Gender (Female - Male) Height (in centimeters) (Between 150 cm and 185 cm) Weight (in kilograms) (Between 42 kg and 175 kg) Physical Score (Between 15 and 60) Calculate "Body Mass Index (BMI)". The formula is: o BMI = Weight / Height (in kg/m) Question 1: Fill the below table. Minimum Maximum Median Arithmetic Std. Mean Deviation Height Weight BMI Physical Score Question 2: Create a new variable called "Physical Score 2" by following the below rules. Fill the below table for this new variable. Low Normal High 15 Physical score < 30 30 Physical score < 45 45 Physical score 60 Normal High N % Low Question 3: Create a table for Gender. Decide which table design is better; the table in Question 1 or in Question 2? Question 4: Create a new variable named "BMI Category" depending on the below rules. BMI < 18.50 18.50 s BMI < 25 25 s BMI < 30 category is "Underweight" category is "Normal" category is "Overweight" category is "Obese" 30 s BMI Question 5: Create a table for BMI Category. Choose your own table design. Question 6: Fill the below table for each gender category. Minimum Maximum Median Arithmetic Mean Std. Deviation Height Weight BMI Physical Score Question 7: Answer the below questions. 1- How many low physical score males? 2- How many normal physical score females? 3- How many obese females? 4- How many overweight low physical score person? 5- How many underweight males? 6- What % of females has high physical score? 7- What % of normal physical score people are female? 8- What % of obsesses has low physical score? 9- What % of normal physical score people are male? 10-What % of total sample have low score & are obese? At the end, three files must be uploaded to the course web site: 1. Final complete SPSS data file. 2. Final SPSS output file that contains all the calculations asked. 3. This word document with all the related answers written on.
Step by Step Solution
★★★★★
3.48 Rating (148 Votes )
There are 3 Steps involved in it
Step: 1

Get Instant Access to Expert-Tailored Solutions
See step-by-step solutions with expert insights and AI powered tools for academic success
Step: 2

Step: 3

Ace Your Homework with AI
Get the answers you need in no time with our AI-driven, step-by-step assistance
Get Started


