

Answered step by step
Verified Expert Solution
Question
1 Approved Answer
Prepare a financial statement analysis in terms of liquidity, solvency, profitability and efficiency of the following company. Jollibee Foods Corporation Security Information: Sector: Subsector: Corporate
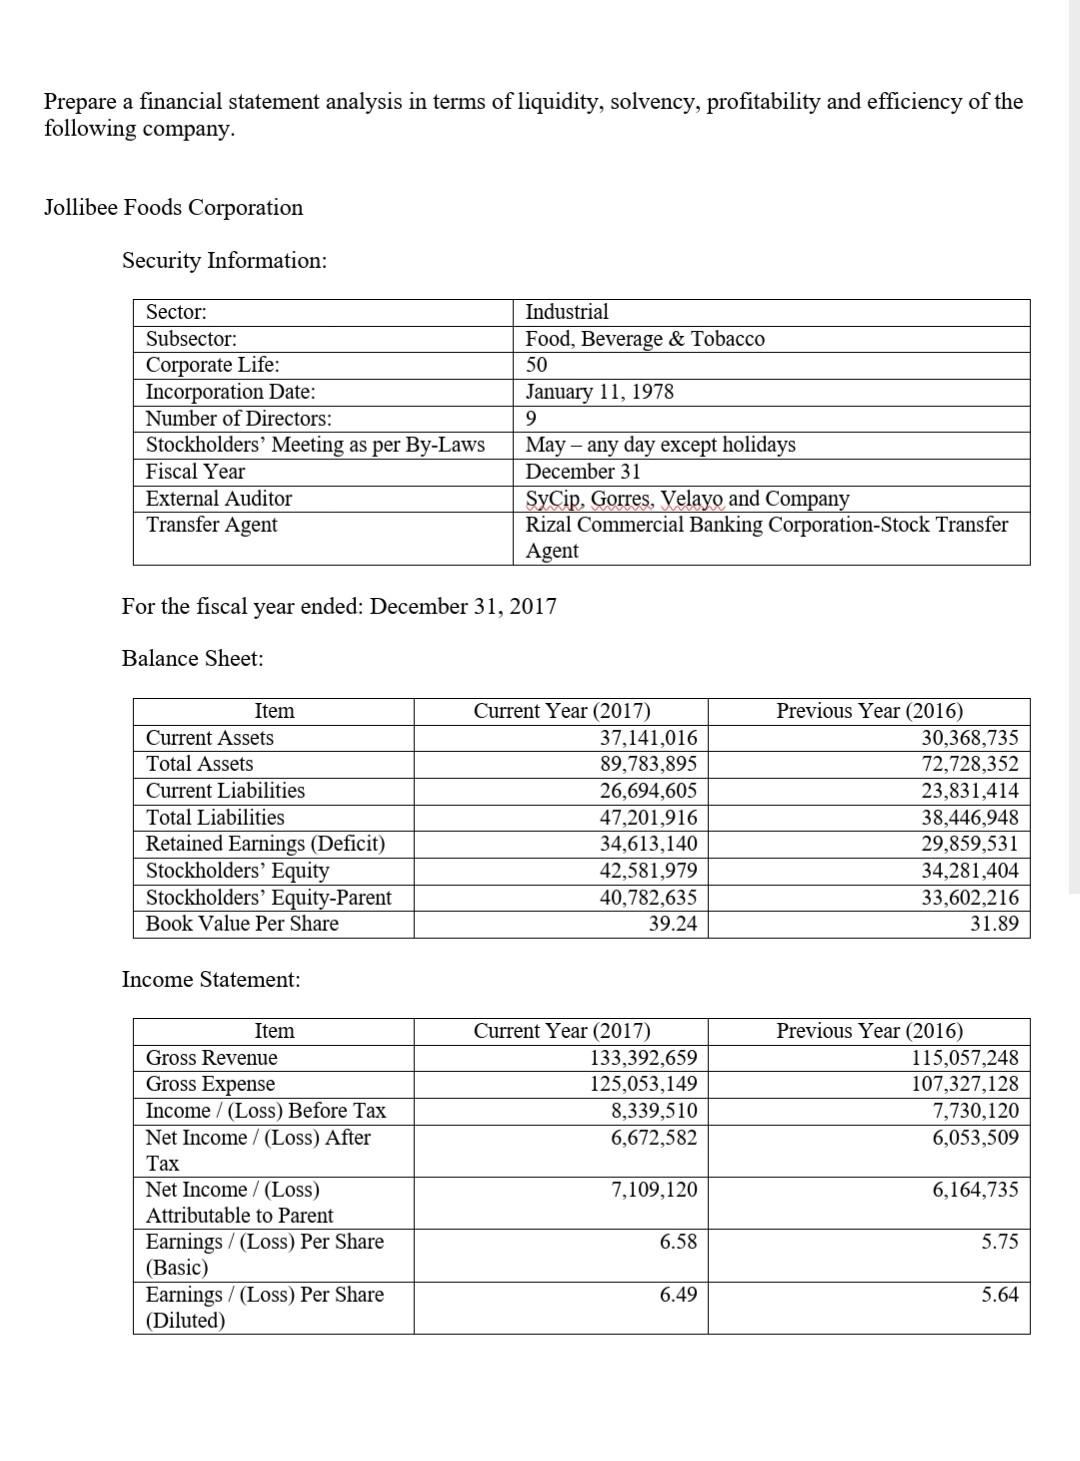
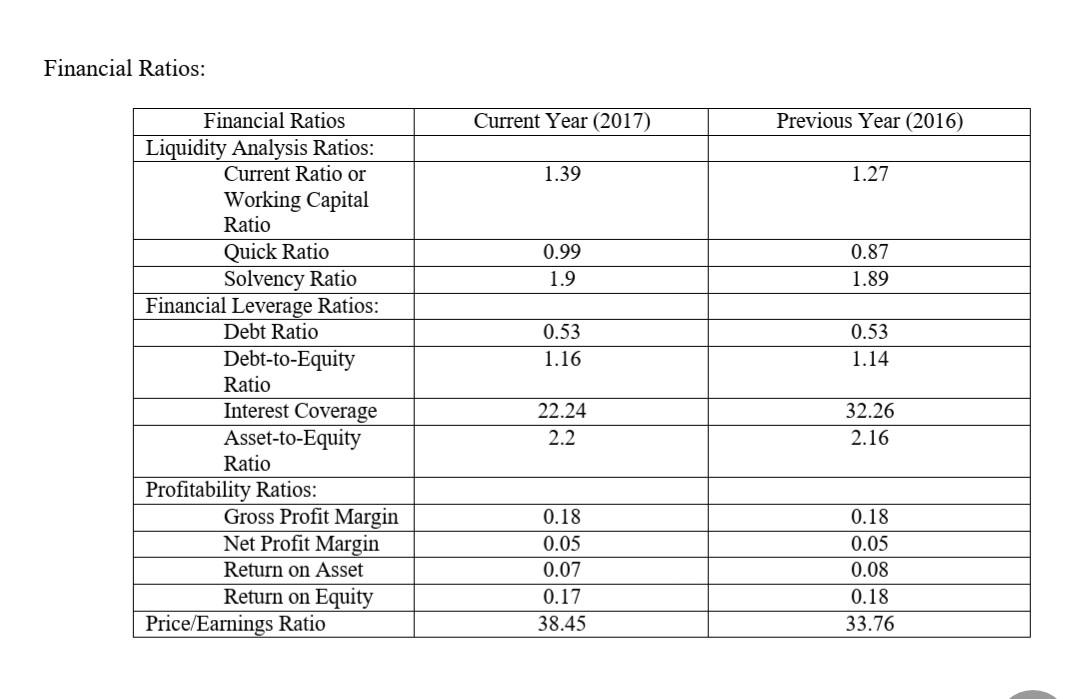
Prepare a financial statement analysis in terms of liquidity, solvency, profitability and efficiency of the following company. Jollibee Foods Corporation Security Information: Sector: Subsector: Corporate Life: Incorporation Date: Number of Directors: Stockholders' Meeting as per By-Laws Fiscal Year External Auditor Transfer Agent Industrial Food, Beverage & Tobacco 50 January 11, 1978 9 May - any day except holidays December 31 SyCip, Gorres, Velayo and Company Rizal Commercial Banking Corporation-Stock Transfer Agent For the fiscal year ended: December 31, 2017 Balance Sheet: Item Current Assets Total Assets Current Liabilities Total Liabilities Retained Earnings (Deficit) Stockholders' Equity Stockholders' Equity-Parent Book Value Per Share Current Year (2017) 37,141,016 89,783,895 26,694,605 47,201,916 34,613,140 42,581,979 40,782,635 39.24 Previous Year (2016) 30,368,735 72,728,352 23,831,414 38,446,948 29,859,531 34,281,404 33,602,216 31.89 Income Statement: Current Year (2017) 133,392,659 125,053,149 8,339,510 6,672,582 Previous Year (2016) 115,057,248 107,327,128 7,730,120 6,053,509 Item Gross Revenue Gross Expense Income /(Loss) Before Tax Net Income /(Loss) After Tax Net Income / (Loss) Attributable to Parent Earnings /(Loss) Per Share (Basic) Earnings /(Loss) Per Share (Diluted) 7,109,120 6,164,735 6.58 5.75 6.49 5.64 Financial Ratios: Current Year (2017) Previous Year (2016) 1.39 1.27 0.99 1.9 0.87 1.89 0.53 1.16 0.53 1.14 Financial Ratios Liquidity Analysis Ratios: Current Ratio or Working Capital Ratio Quick Ratio Solvency Ratio Financial Leverage Ratios: Debt Ratio Debt-to-Equity Ratio Interest Coverage Asset-to-Equity Ratio Profitability Ratios: Gross Profit Margin Net Profit Margin Return on Asset Return on Equity Price/Earnings Ratio 22.24 2.2 32.26 2.16 0.18 0.05 0.07 0.17 38.45 0.18 0.05 0.08 0.18 33.76
Step by Step Solution
There are 3 Steps involved in it
Step: 1

Get Instant Access to Expert-Tailored Solutions
See step-by-step solutions with expert insights and AI powered tools for academic success
Step: 2

Step: 3
Ace Your Homework with AI
Get the answers you need in no time with our AI-driven, step-by-step assistance
Get Started
Managerial Finance
Authors: Alan Parkinson
1st Edition
0750618264, 978-0750618267