Question
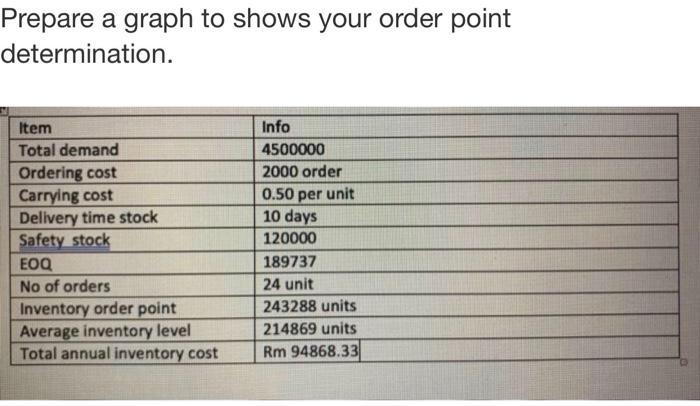
Prepare a graph to shows your order point determination. Item Total demand Ordering cost Carrying cost Delivery time stock Safety stock EOQ No of

Prepare a graph to shows your order point determination. Item Total demand Ordering cost Carrying cost Delivery time stock Safety stock EOQ No of orders Inventory order point Average inventory level Total annual inventory cost Info 4500000 2000 order 0.50 per unit 10 days 120000 189737 24 unit 243288 units 214869 units Rm 94868.33
Step by Step Solution
There are 3 Steps involved in it
Step: 1

Get Instant Access to Expert-Tailored Solutions
See step-by-step solutions with expert insights and AI powered tools for academic success
Step: 2

Step: 3

Ace Your Homework with AI
Get the answers you need in no time with our AI-driven, step-by-step assistance
Get StartedRecommended Textbook for
Intermediate Financial Management
Authors: Eugene F. Brigham, Phillip R. Daves
11th edition
978-1111530266
Students also viewed these Finance questions
Question
Answered: 1 week ago
Question
Answered: 1 week ago
Question
Answered: 1 week ago
Question
Answered: 1 week ago
Question
Answered: 1 week ago
Question
Answered: 1 week ago
Question
Answered: 1 week ago
Question
Answered: 1 week ago
Question
Answered: 1 week ago
Question
Answered: 1 week ago
Question
Answered: 1 week ago
Question
Answered: 1 week ago
Question
Answered: 1 week ago
Question
Answered: 1 week ago
Question
Answered: 1 week ago
Question
Answered: 1 week ago
Question
Answered: 1 week ago
Question
Answered: 1 week ago
Question
Answered: 1 week ago
Question
Answered: 1 week ago
Question
Answered: 1 week ago
View Answer in SolutionInn App


