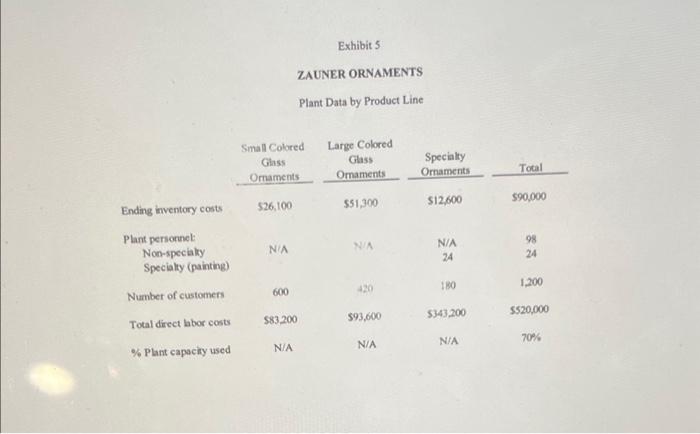
Prepare a report to management answering questions 2,3, & 4 presented in the case study. Do not complete question 1. When completing question 2 use the # of batches as the cost driver for plant administration costs.
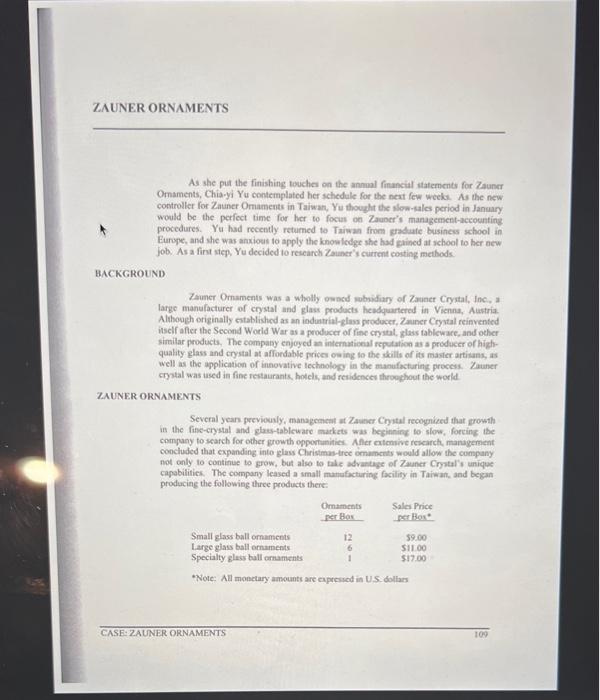
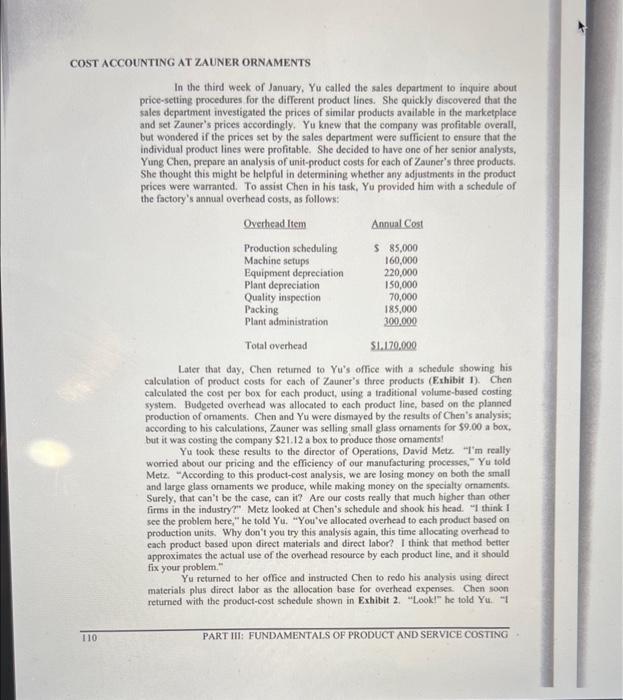
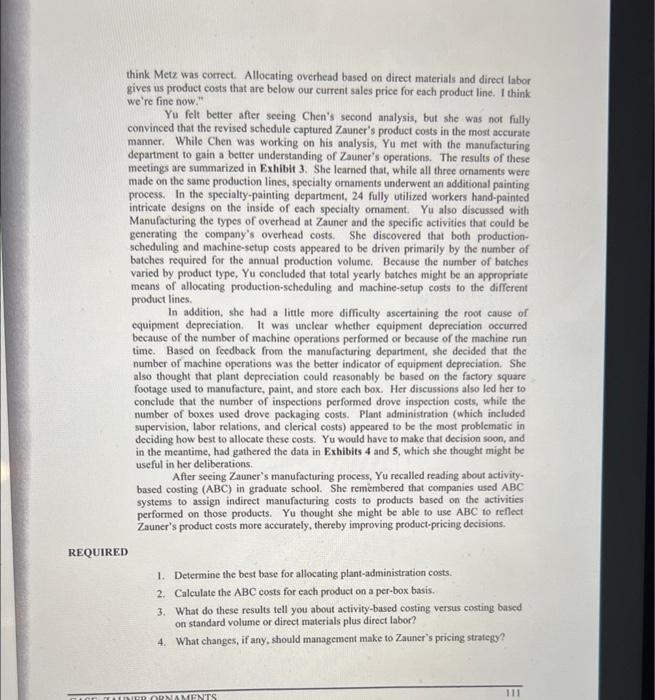
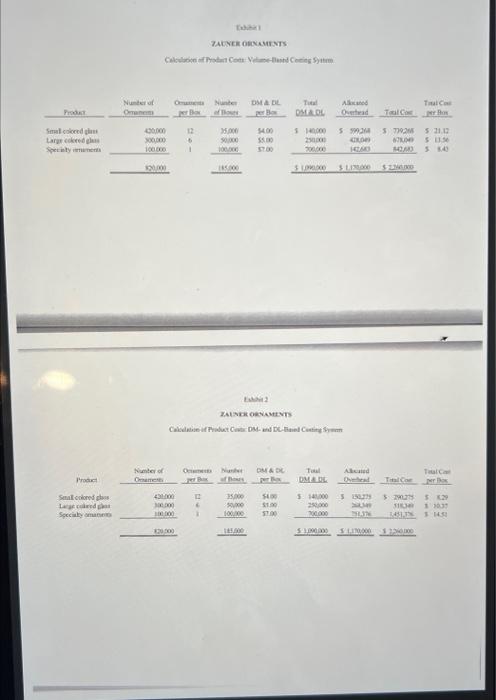
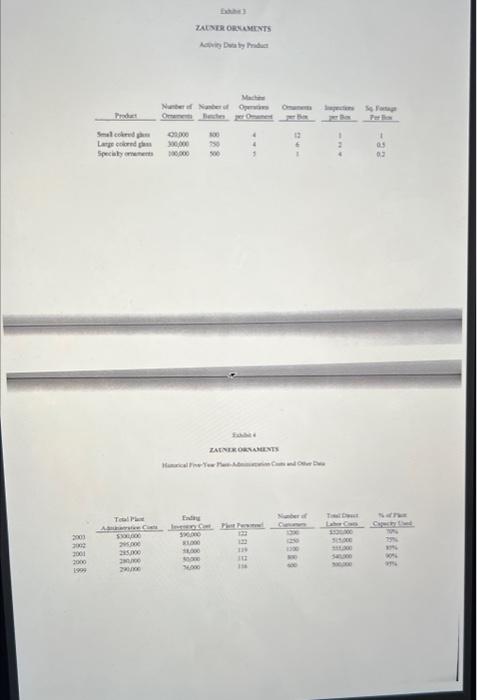
As she put the finishing tovches on the annoll financial statements for Zauner Omaments, Chia-yi Yu contemplated ber schedule for the neat few weeks. As the new controller for Zatiner Ornaments in Taiwan, Yu thought the slow-kales period in January. would be the perfect time for her to focum oe Zauncr's management-accounting procedures. Ya had recenty retumed to Taiwan from gmadute busincs school in Europe, and she was anxious to apply the knowiledge she had gained at achool to ber acw fob. As a first step, Ye decided to research Zauner's current costing methods. BACKGROUND Zauner Ormaments was a wholly owncd subsidiary of Zauner Cryatal, Inc. a large manulacturer of crystal and glass prodocts headquartered in Vicnna, Austria. Althoogh originally citablished as an induatrial-glas prodocer, Zaner Crytal reinvented iscif after the Second World War as a producer of fine crysital, glass fableware, and other similar products. The company eajoycd an internaticeal reputation as a producer of highquality glass and crystal at affordable prices oaing to the skills of its master artitans, as well as the application of innovative lechnolory in the manufacturing process. Zauner cryatal was used in fine restaurants, hotels, and retidences throeghout the world. ZAUNER ORNAMENTS Several yean previoualy, manageneat at Zauner Cryital recoynuiced that growith in the finc-crystal and glae-tablewart markets was beginting to slow, foreing the company to search for other growth oppontanitich. Afler eatenive research management concluded that expanding into glass Christmas-tree omaments would allow the company not only to continue to grow, but also to fale advantage of Zouner Crystal's unique capabilities. The compary leased a small manufacturiag facility in Taiwan, and began producing the following thrce products there: "Note: All monetary amounts are expresiod in US dollars In the third week of Janaary. Yu called the sales department to inquire about price-setting procedures for the different product lines. She quickly discovered that the sales department investigated the prices of similar products available in the marketplace and set Zauner's prices accordingly. Yu knew that the company was profitable overall, but wondered if the prices set by the sales department were sufficient to ensure that the individual product lines were profitable. She decided to have one of her senior analysts. Yung Chen, prepare an analysis of unit-product costs for each of Zauner's three products. She thought this might be helpful in determining whether any adjustments in the product prices were warranted. To assist Chen in his task, Yu provided him with a schedule of the factory's anmual overhead costs, as follows: Later that day, Chen returned to Yu's office with a schedule showing his calculation of product costs for each of Zauner's three products (Exhibit 1). Chen calculated the cost per box for each product, using a traditional volume-based costing system. Budgeted overhead was allocated to each product line, based on the planned production of omaments. Chen and Yu were dismayed by the results of Chen's analysis: according to his calculations, Zauner was selling small glass omaments for $9.00 a box, but it was costing the company $21.12 a box to produce those omaments! Yu took these results to the director of Operations, David Metz. "I'm really worried about our pricing and the efficiency of our manufacturing processes, "Yu told Metz. "According to this product-cost analysis, we are losing moncy on both the small and large glass ornaments we produce, while making money on the specialty ornaments. Surely, that can'i be the case, can it? Are our costs really that much bigher than other firms in the industry?" Metz looked at Chen's schedule and shook his head. "I think I see the problem bere," he told Yu. "You've allocated overhead to each product based on production units. Why don't you try this analysis again, this time allocating overhead to each product based upon direct materials and direct labor? I think that method better approximates the actual we of the overhead resouree by each product line, and it should fix your problem." Yu returned to her oflice and instucted Chen to redo his analysis using direct materials plus direct labor as the allocation base for overhead expenses. Chen soon retumed with the product-cost schedule shown in Exhibit 2. "Look!" he told Yu. "I think Metz was correct. Allocating overhead based on direct materials and direct labor gives us product costs that are below our current sales price for each product line. I think we're fine now." Yu felt better after seeing Chen's second analysis, but she was not fully convinced that the revised schedule captured Zauner's product costs in the most accurate manner. While Chen was working on his analysis, Yu met with the manufacturing department to gain a better understanding of Zauner's operations. The results of these meetings are summarized in Exhibit 3. She learned that, while all three omaments were made on the same production lines, specialty omaments underwent an additional painting process. In the specialty-painting department, 24 fully utilized workers hand-painted intricate designs on the inside of each specialty omament. Yu also discussed with Manufacturing the types of overhead at Zauner and the specific activities that could be generating the company's overhead costs. She discovered that both productionscheduling and machine-setup costs appeared to be driven primarily by the number of batches required for the annual production volume. Because the number of batches varied by product type, Yu concluded that total yearly batches might be an appropriate means of allocating production-scheduling and machine-setup costs to the different product lines. In addition, she had a little more difficulty ascertaining the root cause of equipment depreciation. It was unclear whether equipment depreciation oecurred because of the number of machine operations performed or because of the machine run time. Based on feedback from the manufacturing department, she decided that the number of machine operations was the better indieator of equipment depreciation. She also thought that plant depreciation could reasonably be based on the factory square footage used to manufacture, paint, and store each box. Her discussions atso led her to conclude that the number of inspections performed drove inspection costs, while the number of boxes used drove packaging costs. Plant administration (which included supervision, labor relations, and clerical costs) appeared to be the most problematic in deciding how best to allocate these costs. Yu would have to make that decision soon, and in the meantime, had gathered the data in Exhibits 4 and 5 , which she thought might be useful in her deliberations. After seeing Zauner's manufacturing process, Yu recalled reading about activitybased costing (ABC) in graduate school. She remembered that companies used ABC systems to assign indirect manufacturing costs to products based on the activities performed on those products. Yu thought she might be able to use ABC to reflect Zauner's product costs more accurately, thereby improving product-pricing decisions. 1. Determine the best base for allocating plant-administration costs. 2. Calculate the ABC costs for each product on a per-box basis. 3. What do these results tell you about activity-based costing versus costing based on standard volume or direct materials plus direct labor? 4. What changes, if any, should management make to Zauner's pricing strategy? tobik 74Evei 0iNats Iakin 2 Cadeleie if Prabut Ciak DM- end DC-tiniel Catity Srom = Exhibit 5 ZAUNER ORNAMENTS Plant Data by Product Line


