Question
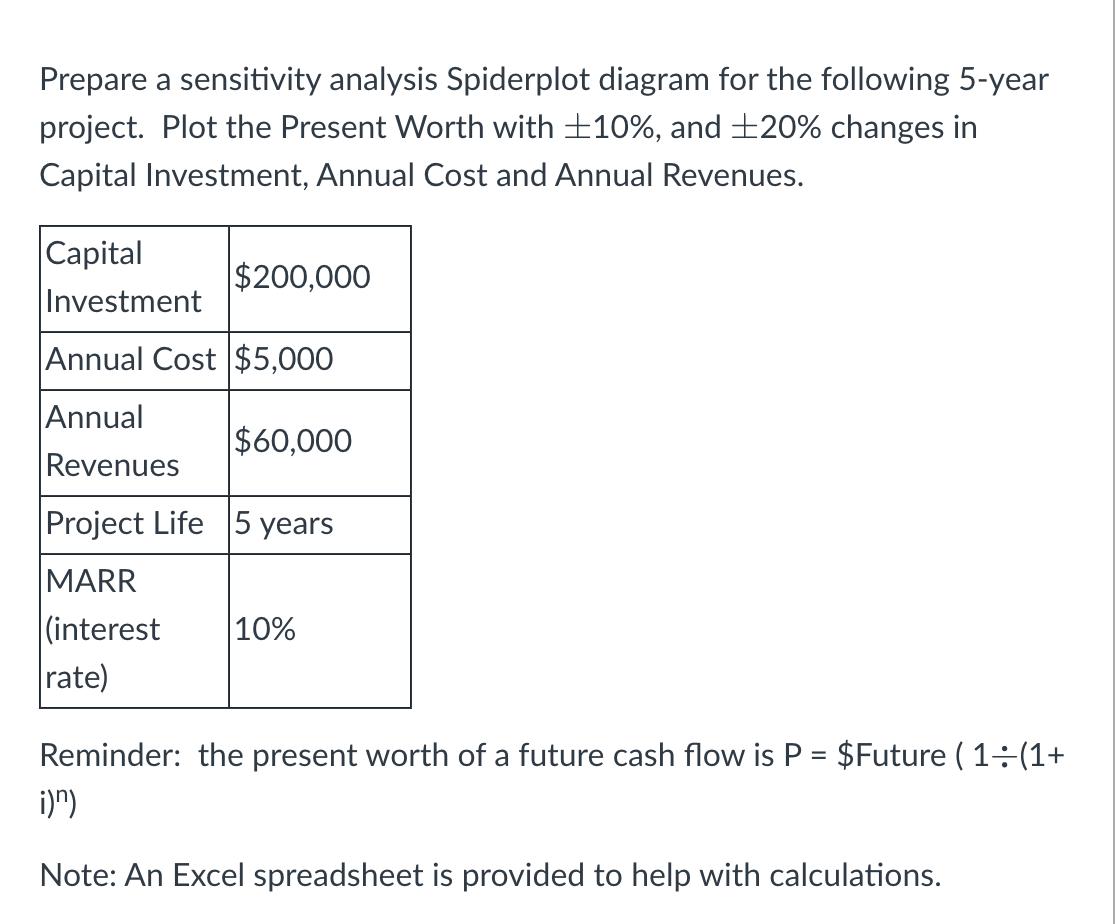
Prepare a sensitivity analysis Spiderplot diagram for the following 5-year project. Plot the Present Worth with 10%, and 20% changes in Capital Investment, Annual

Prepare a sensitivity analysis Spiderplot diagram for the following 5-year project. Plot the Present Worth with 10%, and 20% changes in Capital Investment, Annual Cost and Annual Revenues. Capital Investment $200,000 Annual Cost $5,000 Annual Revenues $60,000 Project Life 5 years MARR (interest rate) 10% Reminder: the present worth of a future cash flow is P = $Future (1+(1+ i)n) Note: An Excel spreadsheet is provided to help with calculations.
Step by Step Solution
3.43 Rating (159 Votes )
There are 3 Steps involved in it
Step: 1
Sure here is the sensitivity analysis spiderplot diagram for the 5year project Variable Base Case 10 ...
Get Instant Access to Expert-Tailored Solutions
See step-by-step solutions with expert insights and AI powered tools for academic success
Step: 2

Step: 3

Ace Your Homework with AI
Get the answers you need in no time with our AI-driven, step-by-step assistance
Get StartedRecommended Textbook for
Intermediate Financial Management
Authors: Eugene F Brigham, Phillip R Daves
14th Edition
0357516664, 978-0357516669
Students also viewed these Finance questions
Question
Answered: 1 week ago
Question
Answered: 1 week ago
Question
Answered: 1 week ago
Question
Answered: 1 week ago
Question
Answered: 1 week ago
Question
Answered: 1 week ago
Question
Answered: 1 week ago
Question
Answered: 1 week ago
Question
Answered: 1 week ago
Question
Answered: 1 week ago
Question
Answered: 1 week ago
Question
Answered: 1 week ago
Question
Answered: 1 week ago
Question
Answered: 1 week ago
Question
Answered: 1 week ago
Question
Answered: 1 week ago
Question
Answered: 1 week ago
Question
Answered: 1 week ago
Question
Answered: 1 week ago
Question
Answered: 1 week ago
Question
Answered: 1 week ago
Question
Answered: 1 week ago
Question
Answered: 1 week ago
View Answer in SolutionInn App


