

Answered step by step
Verified Expert Solution
Question
1 Approved Answer
Prepare any necessary charts in either Ms Excel or MiniTab. Prepare written answers using word processing software. Submit your collection of answers in ONE file
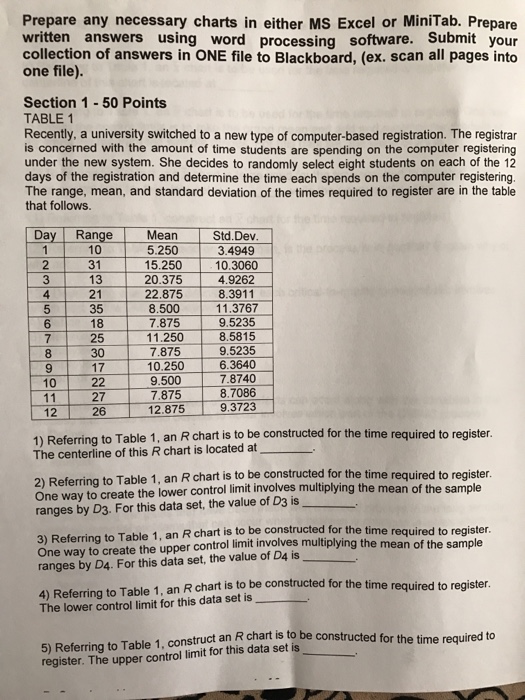
 Prepare any necessary charts in either Ms Excel or MiniTab. Prepare written answers using word processing software. Submit your collection of answers in ONE file to Blackboard, (ex. scan all pages into one file). Section 1 50 Points TABLE 1 Recently, a university switched to a new type of computer-based registration. The registrar is concerned with the amount of time students are spending on the computer registering under the new system. She decides to randomly select eight students on each of the 12 days of the registration and determine the time each spends on the computer registering. The range, mean, and standard deviation of the times required to register are in the table that follows. Day Range Mean Std.Dev 1 10 3.4949 2 31 15.250 10.3060 3 13 20.375 4.9262 4 21 22.875 8.3911 35 8.500 11.3767 6 18 7.875 9.5235 25 11.250 8.5815 9.5235 8 30 7.875 17 10.250 6.3640 9 10 7.8740 9.500 27 7.875 12.875 8.7086 9.3723 12 1) Referring to Table 1. an to constructed for the time required to register. The centerline of this R chart is located at ructed for the time required to register. 2) Referring to Table 1, an R is be multiplying m One way to create the lower control limit involves the of the sample ranges by D3. For this data set, the value of D3 is 3) Referring to Table 1, an R chart is to be constructed for the time required to register. One way to create the upper control limit involves ying the mean of the sample ranges by D4. For this data set, the value of D4 is Refening to Table 1, an R be constructed for the time required to register. The lower control limit for this data set is 5) Referring to Table 1. an R to be constructed for the time required to register. The upper control limit for this data set is
Step by Step Solution
There are 3 Steps involved in it
Step: 1

Get Instant Access to Expert-Tailored Solutions
See step-by-step solutions with expert insights and AI powered tools for academic success
Step: 2

Step: 3
Ace Your Homework with AI
Get the answers you need in no time with our AI-driven, step-by-step assistance
Get Started
Databases On The Web Designing And Programming For Network Access
Authors: Patricia Ju
1st Edition
1558515100, 978-1558515109