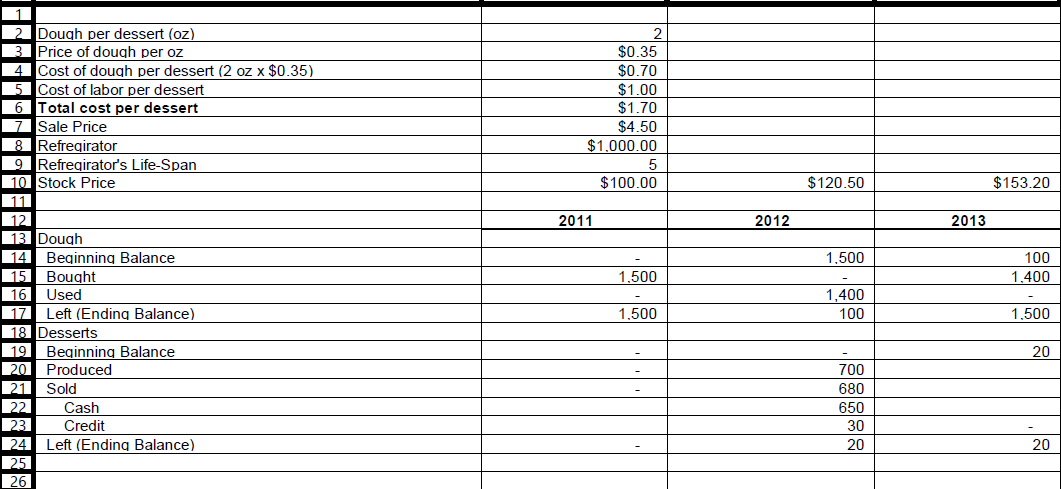
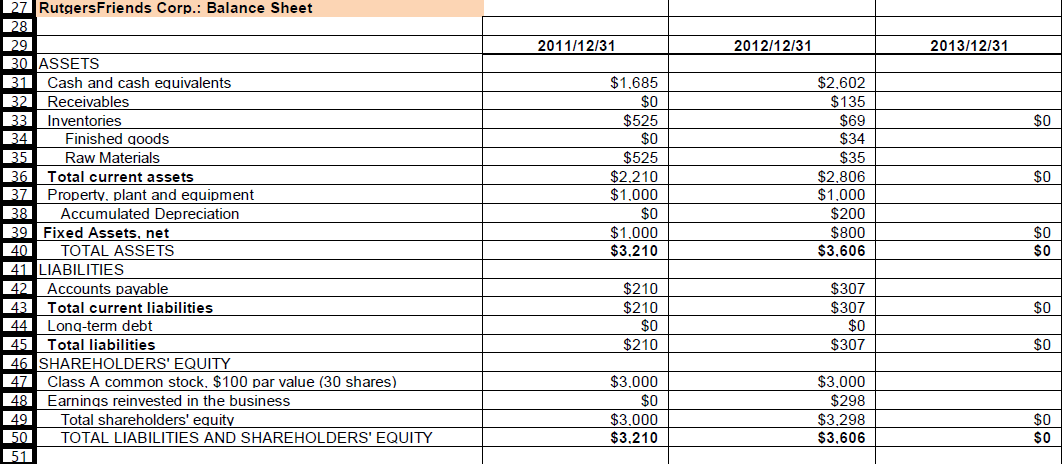
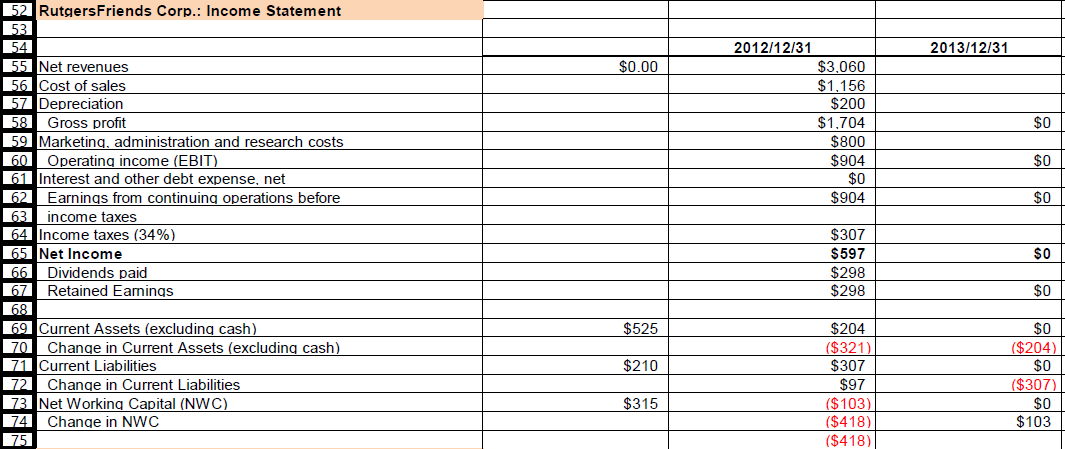
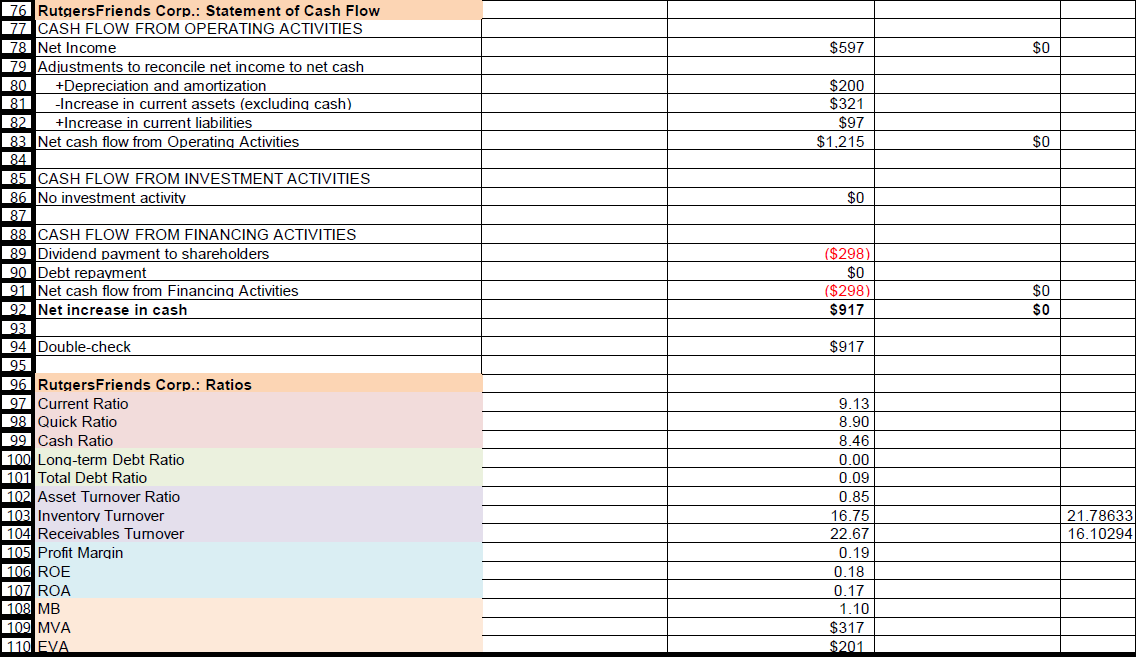
Prepare the balance sheet for December 31, 2013. Prepare the income statement for RFC for fiscal year 2013. Prepare the statement of cash flows for RFC for fiscal year 2013.
a. What was the amount of total assets for RFC on December 31, 2013?
b. What was the amount of net income for RFC for fiscal year 2013?
c. From the statement of cash flows, what was the total net change in cash for RFC during fiscal year 2013? Use positive numbers for increases in cash positions, negative numbers for decreases.
d. What was the quick ratio for RFC on December 31, 2013?
e. Suppose the stock price for RFC was $153.20 on December 31, 2013. What was the market-to-book ratio for RFC on December 31, 2013?


1 22 Dough per dessert (oz) 3 Price of dough per oz 4 Cost of dough per dessert (2 oz x $0.35) 5 Cost of labor per dessert 6 Total cost per dessert 7 Sale Price 8 Refregirator 9 Refregirator's Life-Span 10 Stock Price 2 $0.35 $0.70 $1.00 $1.70 $4.50 $1.000.00 $100.00 $120.50 $153.20 111' 2011 2012 2013 1.500 100 1.400 1,500 1,400 100 1,500 1.500 12 13 Dough 14 Beginning Balance 15 Bought 16 Used 17 Left (Ending Balance) 18 Desserts 19 Beginning Balance 20 Produced 21 Sold 22 Cash Credit 224 Left (Ending Balance) 25 26 20 700 680 650 30 20 23 20 2011/12/31 2012/12/31 2013/12/31 $0 27. RutgersFriends Corp.: Balance Sheet 28 29 301 ASSETS 31 Cash and cash equivalents 32 Receivables 133 Inventories 34 Finished goods 35 Raw Materials 136 Total current assets 137 Property, plant and equipment 38 Accumulated Depreciation 39 Fixed Assets, net 40 TOTAL ASSETS 41 LIABILITIES 42 Accounts payable 43 Total current liabilities 44 Long-term debt 245 Total liabilities 46 SHAREHOLDERS' EQUITY 47 Class A common stock, $100 par value (30 shares) 48 Earnings reinvested in the business _49 Total shareholders' equity 50 TOTAL LIABILITIES AND SHAREHOLDERS' EQUITY $1.685 $0 $525 $0 $525 $2.210 $1,000 $0 $1.000 $3.210 $2,602 $135 $69 $34 $35 $2.806 $1,000 $200 $800 $3,606 $0 $0 $0 $307 $0 $210 $210 $0 $210 $307 $0 $307 $0 $3.000 $0 $3.000 $3.210 $3.000 $298 $3,298 $3,606 $0 $0 511 $597 $0 $200 $321 $97 $1.215 $0 $0 ($298) $0 ($298) $917 $0 $0 76 RutgersFriends Corp.: Statement of Cash Flow 77 CASH FLOW FROM OPERATING ACTIVITIES 78 Net Income 79 Adjustments to reconcile net income to net cash 80 +Depreciation and amortization 81 -Increase in current assets (excluding cash) 82 +Increase in current liabilities 83 Net cash flow from Operating Activities 84 85 CASH FLOW FROM INVESTMENT ACTIVITIES 86 No investment activity 87 88 CASH FLOW FROM FINANCING ACTIVITIES 89 Dividend payment to shareholders 90 Debt repayment 91 Net cash flow from Financing Activities 92 Net increase in cash 93 94 Double-check 95 96 RutgersFriends Corp.: Ratios 97 Current Ratio 98 Quick Ratio 99 Cash Ratio 100 Long-term Debt Ratio 1011 Total Debt Ratio 102 Asset Turnover Ratio 103 Inventory Turnover 104 Receivables Turnover 105 Profit Margin 106 ROE 107 ROA 108 MB 109 MVA 110 EVA $917 9.13 8.90 8.46 0.00 0.09 0.85 16.75 22.67 0.19 0.18 0.17 1.10 $317 $201 21.78633 16.10294 1 22 Dough per dessert (oz) 3 Price of dough per oz 4 Cost of dough per dessert (2 oz x $0.35) 5 Cost of labor per dessert 6 Total cost per dessert 7 Sale Price 8 Refregirator 9 Refregirator's Life-Span 10 Stock Price 2 $0.35 $0.70 $1.00 $1.70 $4.50 $1.000.00 $100.00 $120.50 $153.20 111' 2011 2012 2013 1.500 100 1.400 1,500 1,400 100 1,500 1.500 12 13 Dough 14 Beginning Balance 15 Bought 16 Used 17 Left (Ending Balance) 18 Desserts 19 Beginning Balance 20 Produced 21 Sold 22 Cash Credit 224 Left (Ending Balance) 25 26 20 700 680 650 30 20 23 20 2011/12/31 2012/12/31 2013/12/31 $0 27. RutgersFriends Corp.: Balance Sheet 28 29 301 ASSETS 31 Cash and cash equivalents 32 Receivables 133 Inventories 34 Finished goods 35 Raw Materials 136 Total current assets 137 Property, plant and equipment 38 Accumulated Depreciation 39 Fixed Assets, net 40 TOTAL ASSETS 41 LIABILITIES 42 Accounts payable 43 Total current liabilities 44 Long-term debt 245 Total liabilities 46 SHAREHOLDERS' EQUITY 47 Class A common stock, $100 par value (30 shares) 48 Earnings reinvested in the business _49 Total shareholders' equity 50 TOTAL LIABILITIES AND SHAREHOLDERS' EQUITY $1.685 $0 $525 $0 $525 $2.210 $1,000 $0 $1.000 $3.210 $2,602 $135 $69 $34 $35 $2.806 $1,000 $200 $800 $3,606 $0 $0 $0 $307 $0 $210 $210 $0 $210 $307 $0 $307 $0 $3.000 $0 $3.000 $3.210 $3.000 $298 $3,298 $3,606 $0 $0 511 $597 $0 $200 $321 $97 $1.215 $0 $0 ($298) $0 ($298) $917 $0 $0 76 RutgersFriends Corp.: Statement of Cash Flow 77 CASH FLOW FROM OPERATING ACTIVITIES 78 Net Income 79 Adjustments to reconcile net income to net cash 80 +Depreciation and amortization 81 -Increase in current assets (excluding cash) 82 +Increase in current liabilities 83 Net cash flow from Operating Activities 84 85 CASH FLOW FROM INVESTMENT ACTIVITIES 86 No investment activity 87 88 CASH FLOW FROM FINANCING ACTIVITIES 89 Dividend payment to shareholders 90 Debt repayment 91 Net cash flow from Financing Activities 92 Net increase in cash 93 94 Double-check 95 96 RutgersFriends Corp.: Ratios 97 Current Ratio 98 Quick Ratio 99 Cash Ratio 100 Long-term Debt Ratio 1011 Total Debt Ratio 102 Asset Turnover Ratio 103 Inventory Turnover 104 Receivables Turnover 105 Profit Margin 106 ROE 107 ROA 108 MB 109 MVA 110 EVA $917 9.13 8.90 8.46 0.00 0.09 0.85 16.75 22.67 0.19 0.18 0.17 1.10 $317 $201 21.78633 16.10294


