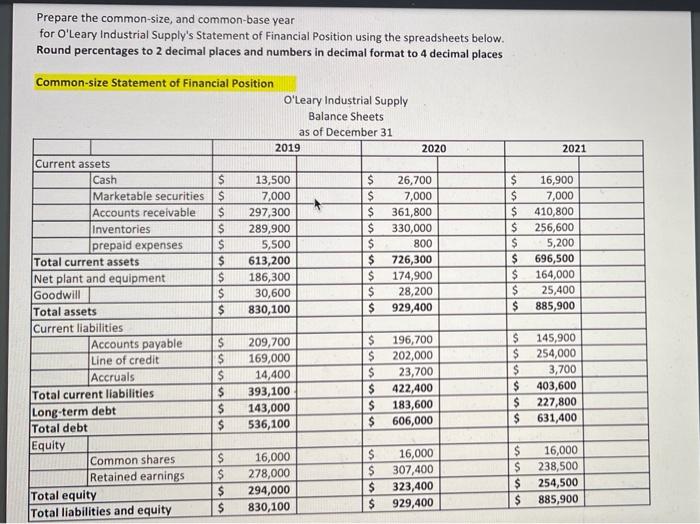
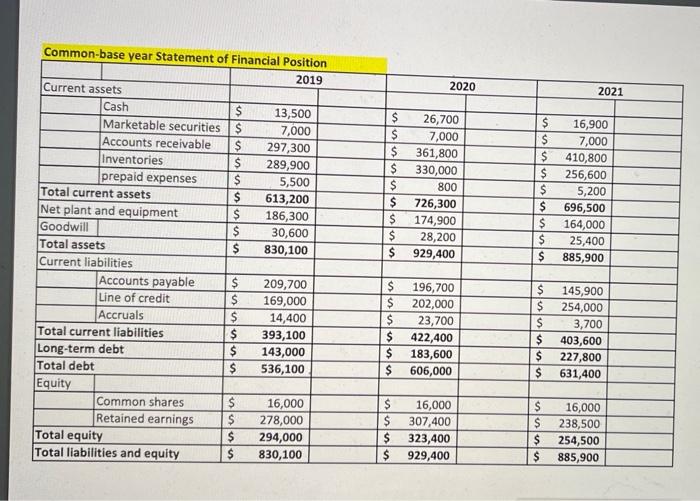
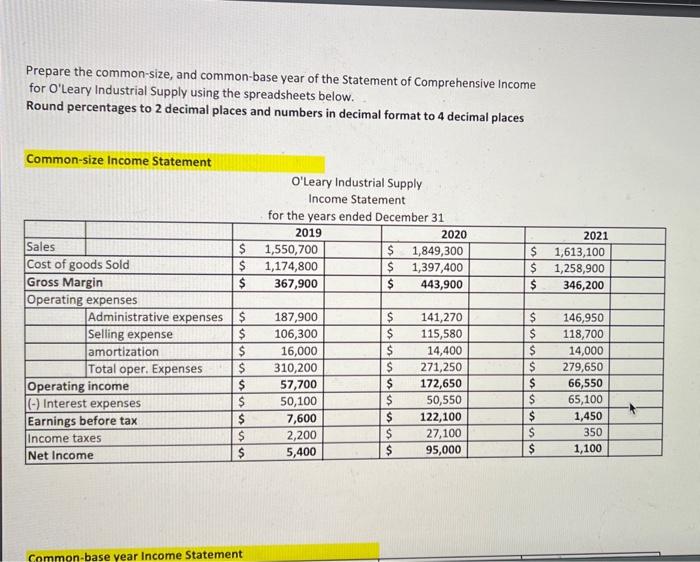
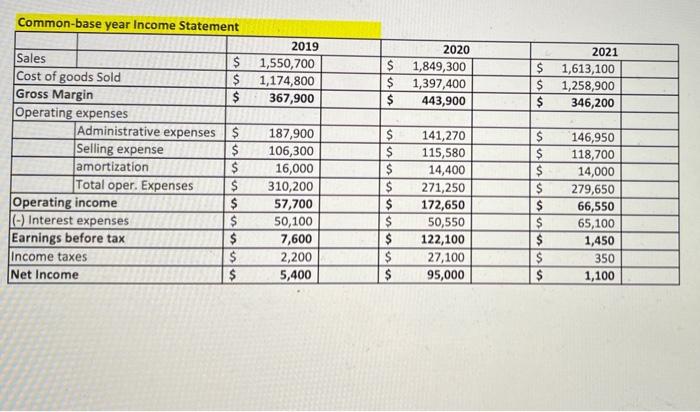
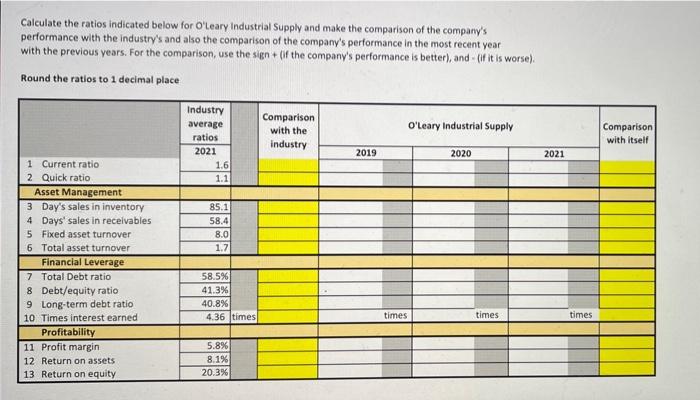
Prepare the common-size, and common-base year for O'Leary Industrial Supply's Statement of Financial Position using the spreadsheets below. Round percentages to 2 decimal places and numbers in decimal format to 4 decimal places Common-size Statement of Financial Position O'Leary Industrial Supply Balance Sheets as of December 31 2019 2020 2021 Current assets Cash 13,500 $ 26,700 $ 16,900 Marketable securities $ 7,000 $ 7,000 $ 7,000 Accounts receivable * $ 297,300 $ 361,800 $ 410,800 Inventories $ 289,900 330,000 $ 256,600 prepaid expenses S 5,500 $ 800 $ 5,200 Total current assets $ 613,200 $ 726,300 $ 696,500 Net plant and equipment $ 186,300 $ 174,900 $ 164,000 Goodwill $ 30,600 $ 28,200 $ 25,400 Total assets $ 830,100 $ 929,400 $ 885,900 Current liabilities Accounts payable $ 209,700 $ 196,700 $ 145,900 Line of credit $ 169,000 $ 202,000 $ 254,000 Accruals $ 14,400 $ 23,700 $ 3,700 Total current liabilities $ 393,100 $ 422,400 $ 403,600 $ Long-term debt 143,000 $ $ 183,600 227,800 Total debt $ 536,100 $ 606,000 $ 631,400 Equity Common shares $ 16,000 S 16,000 $ 16,000 Retained earnings $ 278,000 $ 307,400 $ 238,500 $ 294,000 Total equity $ 323,400 $ 254,500 $ Total liabilities and equity $ 929,400 830,100 885,900 ul 2020 2021 $ Common-base year Statement of Financial Position 2019 Current assets Cash $ 13,500 Marketable securities $ 7,000 Accounts receivable $ 297,300 Inventories $ 289,900 prepaid expenses $ 5,500 Total current assets $ 613,200 Net plant and equipment $ 186,300 Goodwill $ 30,600 Total assets $ 830,100 Current liabilities Accounts payable $ 209,700 Line of credit $ 169,000 Accruals $ 14,400 Total current liabilities $ 393,100 Long-term debt $ 143,000 Total debt $ 536,100 Equity Common shares $ 16,000 Retained earnings 278,000 Total equity 294,000 Total liabilities and equity $ 830,100 $ 26,700 $ 7,000 $ 361,800 $ 330,000 $ 800 $ 726,300 $ 174,900 $ 28,200 $ 929,400 16,900 7,000 410,800 256,600 5,200 696,500 164,000 25,400 885,900 $ $ $ $ $ $ $ uuuu $ $ 196,700 $ 202,000 $ 23,700 $ 422,400 $ 183,600 $ 606,000 $ $ $ $ 145,900 254,000 3,700 403,600 227,800 631,400 $ $ $ $ 16,000 307,400 323,400 929,400 $ 16,000 $ 238,500 $ 254,500 $ 885,900 Prepare the common-size, and common-base year of the Statement of Comprehensive Income for O'Leary Industrial Supply using the spreadsheets below. Round percentages to 2 decimal places and numbers in decimal format to 4 decimal places Common-size Income Statement O'Leary Industrial Supply Income Statement for the years ended December 31 2019 2020 1,550,700 $ 1,849,300 1,174,800 $ 1,397,400 367,900 $ 443,900 2021 $ 1,613,100 $ 1,258,900 $ 346,200 luun $ $ Sales $ Cost of goods Sold $ Gross Margin $ Operating expenses Administrative expenses $ Selling expense $ amortization $ Total oper. Expenses $ Operating income $ (-) Interest expenses Earnings before tax $ Income taxes $ Net Income $ MUMU 187,900 106,300 16,000 310,200 57,700 50,100 7,600 2,200 5,400 $ $ $ $ $ $ $ $ $ 141,270 115,580 14,400 271,250 172,650 50,550 122,100 27,100 95,000 $ $ $ $ $ 146,950 118,700 14,000 279,650 66,550 65,100 1,450 350 1,100 Common-base year Income Statement Common-base year Income Statement $ $ $ 2019 1,550,700 1,174,800 367,900 2020 $ 1,849,300 $ 1,397,400 $ 443,900 2021 $ 1,613,100 $ 1,258,900 $ 346,200 Sales Cost of goods Sold Gross Margin Operating expenses Administrative expenses Selling expense amortization Total oper. Expenses Operating income (-) Interest expenses Earnings before tax Income taxes Net Income $ $ $ $ $ $ $ $ $ 187,900 106,300 16,000 310,200 57,700 50,100 7,600 2,200 5,400 $ $ $ $ $ $ $ $ $ 141,270 115,580 14,400 271,250 172,650 50,550 122,100 27,100 95,000 $ $ $ $ $ $ $ $ $ 146,950 118,700 14,000 279,650 66,550 65,100 1,450 350 1,100 Calculate the ratios indicated below for O'Leary Industrial Supply and make the comparison of the company's performance with the industry's and also the comparison of the company's performance in the most recent year with the previous years. For the comparison, use the sign + (if the company's performance is better), and if it is worse). Round the ratios to 1 decimal place O'Leary Industrial Supply Industry average ratios 2021 1.6 1.1 Comparison with the industry Comparison with itself 2019 2020 2021 85.1 58.4 8.0 1.7 1 Current ratio 2 Quick ratio Asset Management 3 Day's sales in inventory 4 Days' sales in receivables 5 Fixed asset turnover 6 Total asset turnover Financial Leverage 7 Total Debt ratio 8 Debt/equity ratio 9 Long-term debt ratio 10 Times interest earned Profitability 11 Profit margin 12 Return on assets 13 Return on equity 58.5% 41.3% 40.8% 4.36 times times times times 5.8% 8.1% 20.3%
