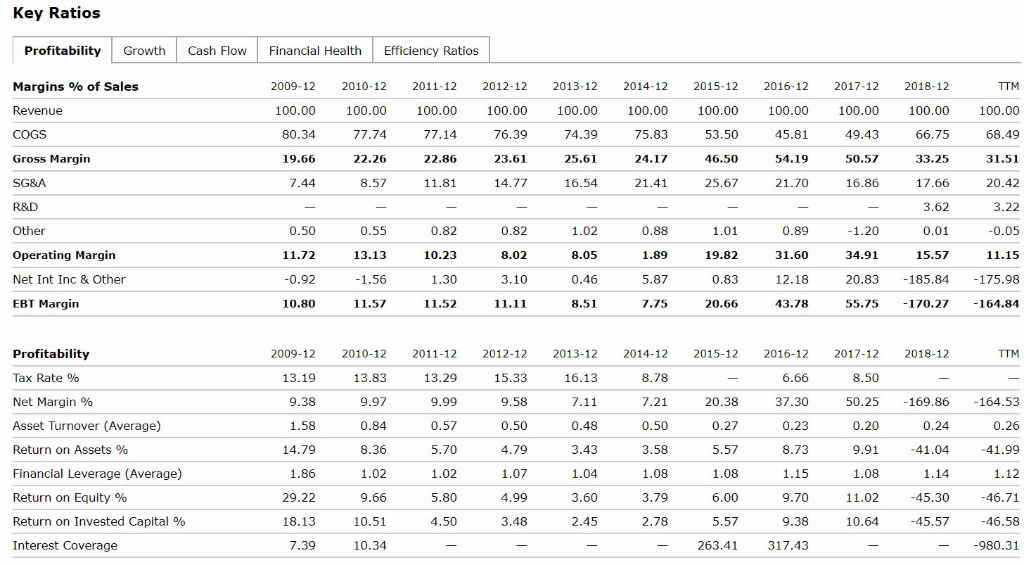
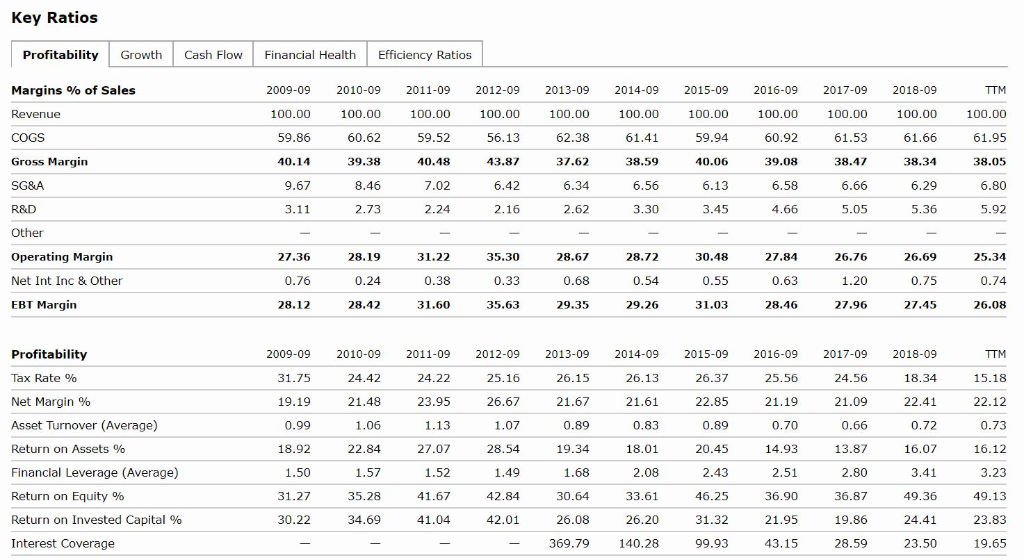
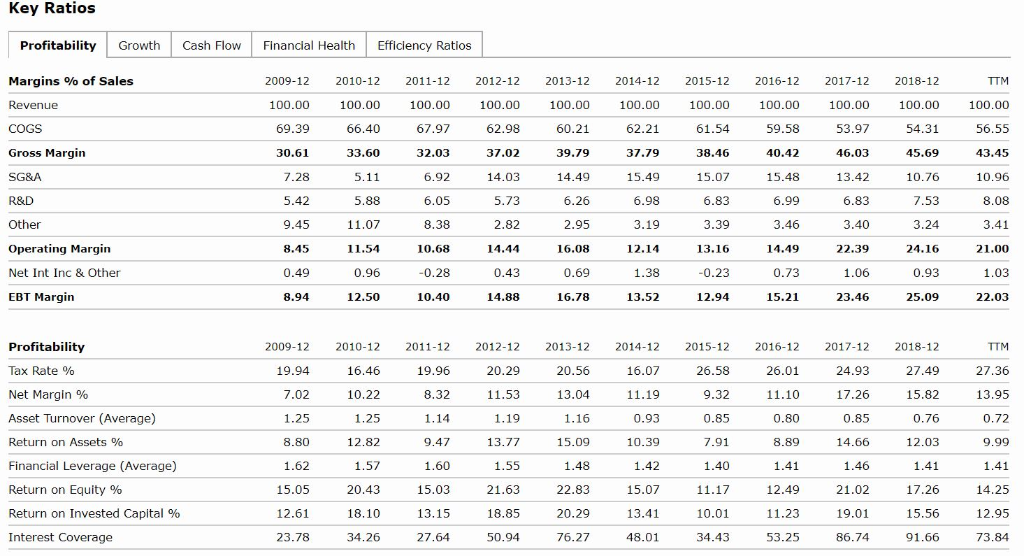
Prepare the competitor financial analysis table by using the following information.
Huawei's Key ratios
 Apple Key Ratios
 Samsung Key Ratios

Key Ratios Profitability Growth Cash Flow Financial Health Efficiency Ratios Margins % of Sales Revenue COGS Gross Margin SG&A 2009-12 100.00 80.34 19.66 7.44 2010-12 100.00 77.74 22.26 8.57 2011-12 100.00 77.14 2 2.86 11.81 2012-12 100.00 76.39 23.61 14.77 2013-12 100.00 7 4.39 25.61 16.54 2014-12 100.00 75.83 24.17 21.41 2015-12 100.00 53.50 46.50 25.67 2016-12 100.00 45.81 54.19 21.70 2017-12 100.00 49.43 5 0.57 16.86 2018-12 100.00 66.75 33.25 17.66 3.62 0.01 15.57 -185.84 -170.27 TTM 100.00 68.49 31.51 20.42 3.22 -0.05 11.15 -175.98 -164.84 R&D Other 0.88 Operating Margin Net Int Inc & Other 0.50 11.72 -0.92 10.80 0.55 13.13 -1.56 11.57 0.82 10.23 1.30 11.52 0.82 8.02 3.10 11.11 1.02 8.05 0.46 8.51 1.89 5.87 .75 1.01 19.82 0.83 20.66 0.89 31.60 12.18 4 3.78 -1.20 34.91 20.83 55.75 EBT Margin 7 2015-12 2018-12 TTM 29 Profitability Tax Rate % Net Margin % Asset Turnover (Average) Return on Assets % Financial Leverage (Average) Return on Equity % Return on invested Capital % Interest Coverage 2009-12 13.19 9.38 1.58 14.79 1.86 29.22 18.13 7.39 2010-12 13.83 9.97 0.84 8 .36 1.02 9.66 10.51 10.34 2011-12 2012-12 13.29 1 5.33 9.999 .58 0.57 0.50 5.70 4.79 1 .02 1.07 5.80 4.99 4.50 3.48 - - 2013-12 16.13 7.11 0.48 3.43 1.04 3.60 2.45 - 2014-12 8.78 7.21 0.50 3.58 1.08 3.79 2.78 - 20.38 0.27 5 .57 1.08 6 .00 5.57 263.41 2015-12 6.66 37.30 0.23 8.73 1.15 9.70 9.38 317.43 2017-12 8.50 50.25 0.20 9.91 1.08 11.02 10.64 -169.86 0.24 -41.04 1.14 -45.30 -45.57 - -164.53 0.26 -41.99 1.12 -46.71 -46.58 -980.31 Key Ratios Profitability Growth Cash Flow Financial Health Efficiency Ratios Margins % of Sales Revenue COGS Gross Margin 2009-09 100.00 59.86 40.14 9.67 3.11 2010-09 100.00 60.62 39.38 8.46 2.73 2011-09 100.00 59.52 40.48 7 .02 2.24 2012-09 100.00 56.13 43.87 6.42 2.16 2013-09 100.00 62.38 37.62 6.34 2.62 2014-09 100.00 61.41 38.59 6.56 3.30 2015-09 100.00 59.94 40.06 6.13 3.45 2016-09 100.00 60.92 39.08 6.58 4.66 2017-09 100.00 61.53 38.47 6.66 5 .05 2018-09 100.00 61.66 38.34 6.29 5.36 TTM 100.00 61.95 38.05 6 .80 5.92 SG&A R&D Other Operating Margin Net Int Inc & Other EBT Margin 27.36 0.76 28.12 28.19 0.24 28.42 31.22 0.38 31.60 3 5.30 0.33 35.63 28.67 0.68 29.35 28.72 0.54 29.26 30.48 0.55 31.03 0 27.84 .63 28.46 1 26.76 .20 27.96 26.69 0.75 27.45 25.34 0.74 26.08 TTM Profitability Tax Rate % 15.18 Net Margin % Asset Turnover (Average) Return on Assets % Financial Leverage (Average) Return on Equity % Return on Invested Capital % Interest Coverage 2009-09 31.75 19.19 0.99 18.92 1.50 2010-09 24.42 21.48 1 .06 22.84 1.57 2011-09 24.22 23.95 1.13 27.07 1 .52 41.67 41.04 2012-09 25.16 26.67 1.07 2 8.54 1.49 42.84 42.01 - 2013-09 26.15 21.67 0.89 19.34 1.68 30.64 26.08 369.79 2014-09 26.13 21.61 0.83 18.01 2.08 33.61 26.20 140.28 2015-09 26.37 22.85 0.89 20.45 2.43 46.25 31.32 99.93 2016-09 25.56 21.19 0.70 14.93 2.51 36.90 21.95 43.15 2017-09 24.56 2 1.09 0.66 13.87 2.80 36.87 19.86 28.59 2018-09 18.34 22.41 0.72 16.07 3.41 49.36 24.41 23.50 22.12 0.73 16.12 3.23 49.13 23.83 19.65 34.69 30.22 - Key Ratios Profitability Growth Cash Flow Financial Health Efficiency Ratios Margins % of Sales Revenue COGS Gross Margin SG&A R&D 2009-12 100.00 69.39 30.61 7.28 5.42 9.45 8.45 0.49 8.94 2010-12 100.00 66.40 33.60 5.11 5.88 11.07 11.54 0.96 12.50 2011-12 100.00 67.97 3 2.03 6.92 6.05 8 .38 10.68 -0.28 10.40 2012-12 100.00 6 2.98 37.02 14.03 5.73 2.82 14.44 0.43 14.88 2013-12 100.00 60.21 39.79 14.49 6.26 2.95 16.08 0.69 16.78 2014-12 100.00 62.21 37.79 15.49 6.98 3.19 12.14 1.38 13.52 2015-12 100.00 61.54 38.46 15.07 6.83 3.39 13.16 -0.23 12.94 2015-12 100.00 59.58 40.42 15.48 6.99 3.46 14.49 0.73 15.21 2017-12 100.00 53.97 46.03 13.42 6 .83 3.40 22.39 1.06 23.46 2018-12 100.00 54.31 45.69 10.76 7 .53 3.24 24.16 0.93 25.09 TIM 100.00 56.55 43.45 10.96 8.08 3.41 21.00 1.03 22.03 Other Operating Margin Net Int Inc & Other EBT Margin Profitability Tax Rate % Net Margin % Asset Turnover (Average) Return on Assets % Financial Leverage (Average) Return on Equity % Return on Invested Capital % Interest Coverage 2009-12 19.94 7.02 1.25 8.80 1.62 15.05 12.61 23.78 2010-12 16.46 10.22 1.25 12.82 1.57 20.43 18.10 34.26 2011-12 19.96 8 .32 1.14 9.47 1.60 15.03 13.15 27.64 2012-12 20.29 11.53 1.19 13.77 1.55 21.63 18.85 50.94 2013-12 20.56 13.04 1.16 15.09 1.48 22.83 20.29 76.27 2014-12 16.07 11.19 0.93 10.39 1.42 15.07 13.41 48.01 2015-12 26.58 9.32 0.85 7.91 1.40 11.17 10.01 34.43 2016-12 2017-12 26.01 24.93 11.10 17.26 0.80 0.85 8.89 14.66 1.411.46 12.49 21.02 11.23 19.01 5 3.25 86.74 2018-12 TTM 27.49 27.36 15.82 13.95 0.76 0.72 12.03 9 .99 1.411.41 17.26 14.25 15.56 12.95 91.66 73.84 Key Ratios Profitability Growth Cash Flow Financial Health Efficiency Ratios Margins % of Sales Revenue COGS Gross Margin SG&A 2009-12 100.00 80.34 19.66 7.44 2010-12 100.00 77.74 22.26 8.57 2011-12 100.00 77.14 2 2.86 11.81 2012-12 100.00 76.39 23.61 14.77 2013-12 100.00 7 4.39 25.61 16.54 2014-12 100.00 75.83 24.17 21.41 2015-12 100.00 53.50 46.50 25.67 2016-12 100.00 45.81 54.19 21.70 2017-12 100.00 49.43 5 0.57 16.86 2018-12 100.00 66.75 33.25 17.66 3.62 0.01 15.57 -185.84 -170.27 TTM 100.00 68.49 31.51 20.42 3.22 -0.05 11.15 -175.98 -164.84 R&D Other 0.88 Operating Margin Net Int Inc & Other 0.50 11.72 -0.92 10.80 0.55 13.13 -1.56 11.57 0.82 10.23 1.30 11.52 0.82 8.02 3.10 11.11 1.02 8.05 0.46 8.51 1.89 5.87 .75 1.01 19.82 0.83 20.66 0.89 31.60 12.18 4 3.78 -1.20 34.91 20.83 55.75 EBT Margin 7 2015-12 2018-12 TTM 29 Profitability Tax Rate % Net Margin % Asset Turnover (Average) Return on Assets % Financial Leverage (Average) Return on Equity % Return on invested Capital % Interest Coverage 2009-12 13.19 9.38 1.58 14.79 1.86 29.22 18.13 7.39 2010-12 13.83 9.97 0.84 8 .36 1.02 9.66 10.51 10.34 2011-12 2012-12 13.29 1 5.33 9.999 .58 0.57 0.50 5.70 4.79 1 .02 1.07 5.80 4.99 4.50 3.48 - - 2013-12 16.13 7.11 0.48 3.43 1.04 3.60 2.45 - 2014-12 8.78 7.21 0.50 3.58 1.08 3.79 2.78 - 20.38 0.27 5 .57 1.08 6 .00 5.57 263.41 2015-12 6.66 37.30 0.23 8.73 1.15 9.70 9.38 317.43 2017-12 8.50 50.25 0.20 9.91 1.08 11.02 10.64 -169.86 0.24 -41.04 1.14 -45.30 -45.57 - -164.53 0.26 -41.99 1.12 -46.71 -46.58 -980.31 Key Ratios Profitability Growth Cash Flow Financial Health Efficiency Ratios Margins % of Sales Revenue COGS Gross Margin 2009-09 100.00 59.86 40.14 9.67 3.11 2010-09 100.00 60.62 39.38 8.46 2.73 2011-09 100.00 59.52 40.48 7 .02 2.24 2012-09 100.00 56.13 43.87 6.42 2.16 2013-09 100.00 62.38 37.62 6.34 2.62 2014-09 100.00 61.41 38.59 6.56 3.30 2015-09 100.00 59.94 40.06 6.13 3.45 2016-09 100.00 60.92 39.08 6.58 4.66 2017-09 100.00 61.53 38.47 6.66 5 .05 2018-09 100.00 61.66 38.34 6.29 5.36 TTM 100.00 61.95 38.05 6 .80 5.92 SG&A R&D Other Operating Margin Net Int Inc & Other EBT Margin 27.36 0.76 28.12 28.19 0.24 28.42 31.22 0.38 31.60 3 5.30 0.33 35.63 28.67 0.68 29.35 28.72 0.54 29.26 30.48 0.55 31.03 0 27.84 .63 28.46 1 26.76 .20 27.96 26.69 0.75 27.45 25.34 0.74 26.08 TTM Profitability Tax Rate % 15.18 Net Margin % Asset Turnover (Average) Return on Assets % Financial Leverage (Average) Return on Equity % Return on Invested Capital % Interest Coverage 2009-09 31.75 19.19 0.99 18.92 1.50 2010-09 24.42 21.48 1 .06 22.84 1.57 2011-09 24.22 23.95 1.13 27.07 1 .52 41.67 41.04 2012-09 25.16 26.67 1.07 2 8.54 1.49 42.84 42.01 - 2013-09 26.15 21.67 0.89 19.34 1.68 30.64 26.08 369.79 2014-09 26.13 21.61 0.83 18.01 2.08 33.61 26.20 140.28 2015-09 26.37 22.85 0.89 20.45 2.43 46.25 31.32 99.93 2016-09 25.56 21.19 0.70 14.93 2.51 36.90 21.95 43.15 2017-09 24.56 2 1.09 0.66 13.87 2.80 36.87 19.86 28.59 2018-09 18.34 22.41 0.72 16.07 3.41 49.36 24.41 23.50 22.12 0.73 16.12 3.23 49.13 23.83 19.65 34.69 30.22 - Key Ratios Profitability Growth Cash Flow Financial Health Efficiency Ratios Margins % of Sales Revenue COGS Gross Margin SG&A R&D 2009-12 100.00 69.39 30.61 7.28 5.42 9.45 8.45 0.49 8.94 2010-12 100.00 66.40 33.60 5.11 5.88 11.07 11.54 0.96 12.50 2011-12 100.00 67.97 3 2.03 6.92 6.05 8 .38 10.68 -0.28 10.40 2012-12 100.00 6 2.98 37.02 14.03 5.73 2.82 14.44 0.43 14.88 2013-12 100.00 60.21 39.79 14.49 6.26 2.95 16.08 0.69 16.78 2014-12 100.00 62.21 37.79 15.49 6.98 3.19 12.14 1.38 13.52 2015-12 100.00 61.54 38.46 15.07 6.83 3.39 13.16 -0.23 12.94 2015-12 100.00 59.58 40.42 15.48 6.99 3.46 14.49 0.73 15.21 2017-12 100.00 53.97 46.03 13.42 6 .83 3.40 22.39 1.06 23.46 2018-12 100.00 54.31 45.69 10.76 7 .53 3.24 24.16 0.93 25.09 TIM 100.00 56.55 43.45 10.96 8.08 3.41 21.00 1.03 22.03 Other Operating Margin Net Int Inc & Other EBT Margin Profitability Tax Rate % Net Margin % Asset Turnover (Average) Return on Assets % Financial Leverage (Average) Return on Equity % Return on Invested Capital % Interest Coverage 2009-12 19.94 7.02 1.25 8.80 1.62 15.05 12.61 23.78 2010-12 16.46 10.22 1.25 12.82 1.57 20.43 18.10 34.26 2011-12 19.96 8 .32 1.14 9.47 1.60 15.03 13.15 27.64 2012-12 20.29 11.53 1.19 13.77 1.55 21.63 18.85 50.94 2013-12 20.56 13.04 1.16 15.09 1.48 22.83 20.29 76.27 2014-12 16.07 11.19 0.93 10.39 1.42 15.07 13.41 48.01 2015-12 26.58 9.32 0.85 7.91 1.40 11.17 10.01 34.43 2016-12 2017-12 26.01 24.93 11.10 17.26 0.80 0.85 8.89 14.66 1.411.46 12.49 21.02 11.23 19.01 5 3.25 86.74 2018-12 TTM 27.49 27.36 15.82 13.95 0.76 0.72 12.03 9 .99 1.411.41 17.26 14.25 15.56 12.95 91.66 73.84
 Apple Key Ratios
 Samsung Key Ratios


