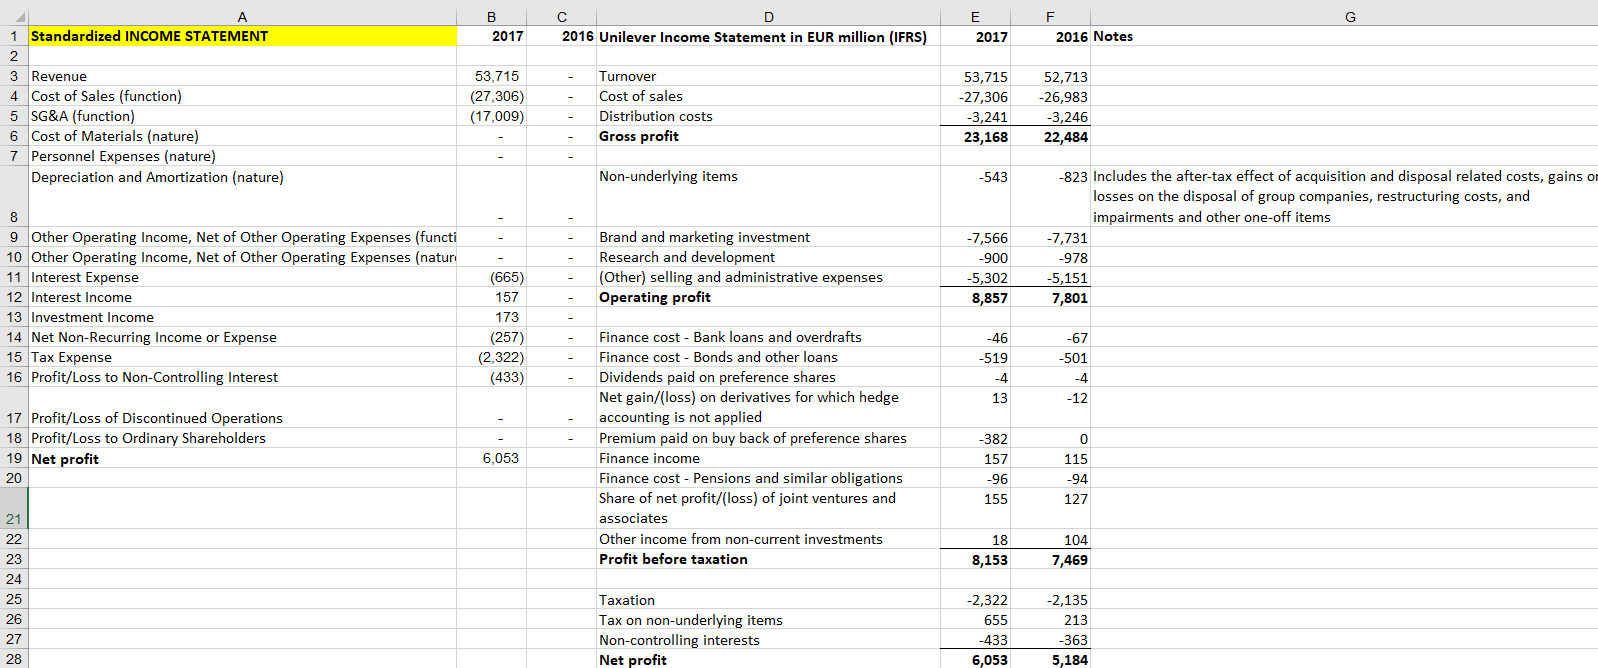
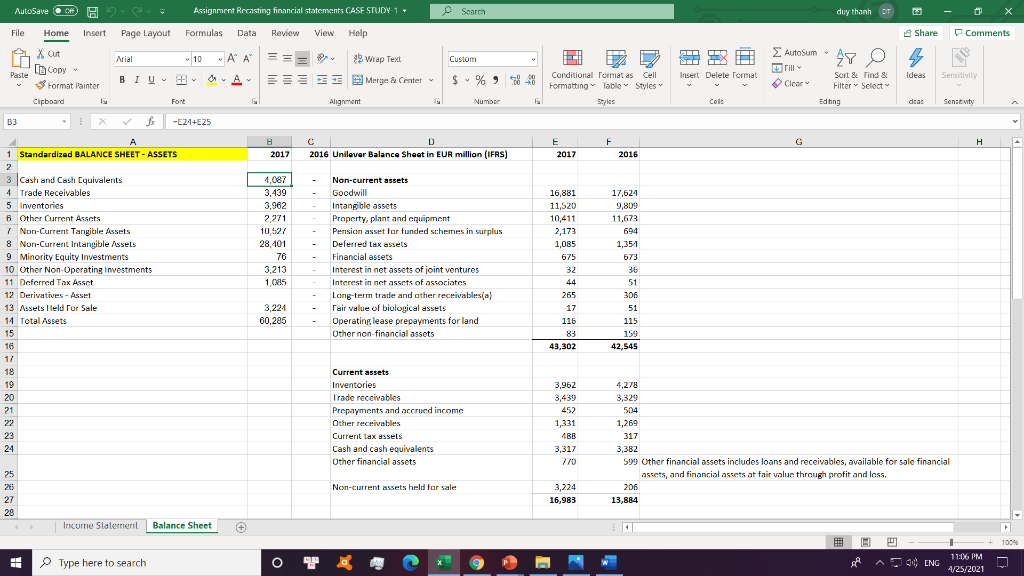
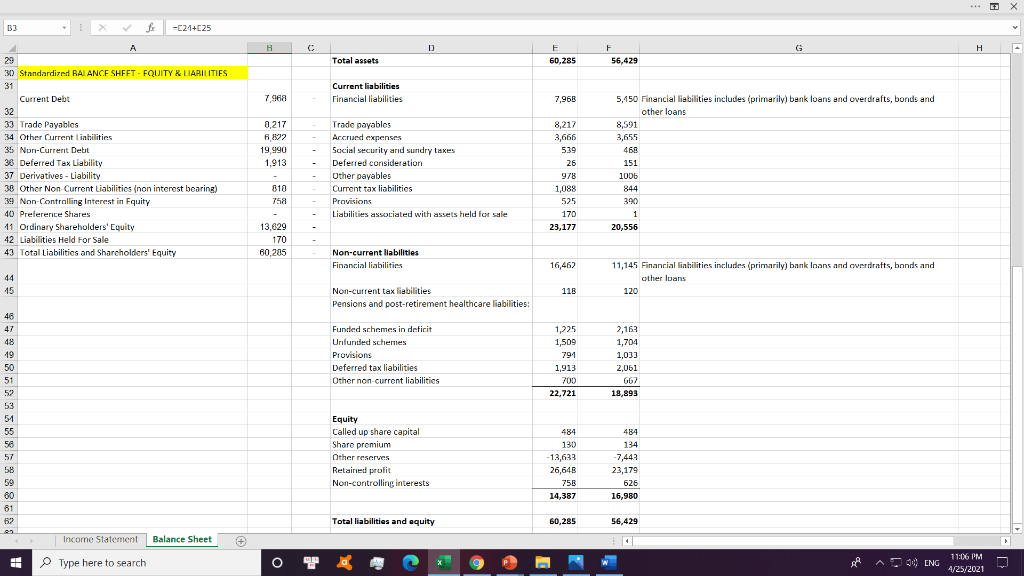
- Prepare the standardized Income Statement and Balance Sheet for the Unilever using from the attached 2016 I/S and B/S information. Assignment Recasting financial statements CASE STUDY-1.xlsx
For Q3 of the Mid-term Assignment, you can use the attached Excel file which was made during the previous class for 2017 I/S and B/S data. For making 2016 standardized I/S and B/S, you can use the file to solve the question by putting the cursor on each cell of the column B in I/S and B/S.


G B 2017 2016 Unilever Income Statement in EUR million (IFRS) E 2017 2016 Notes 1 Standardized INCOME STATEMENT 2 3 Revenue 4 Cost of Sales (function) 5 SG&A (function) 6 Cost of Materials (nature) 7 Personnel Expenses (nature) Depreciation and Amortization (nature) 53,715 (27,306) (17,009) Turnover Cost of sales Distribution costs Gross profit 53,715 -27,306 -3,241 23,168 52,713 -26,983 -3,246 22,484 Non-underlying items -543 8 9 Other Operating Income, Net of Other Operating Expenses (functi 10 Other Operating Income, Net of Other Operating Expenses (natur 11 Interest Expense 12 Interest Income 13 Investment Income 14 Net Non-Recurring Income or Expense 15 Tax Expense 16 Profit/Loss to Non-Controlling Interest Brand and marketing investment Research and development (Other) selling and administrative expenses Operating profit -7,566 -900 -5,302 8,857 -823 Includes the after-tax effect of acquisition and disposal related costs, gains or losses on the disposal of group companies, restructuring costs, and impairments and other one-off items -7,731 -978 -5,151 7,801 (665) 157 173 (257) (2,322) (433) -67 -501 -46 -519 -4 13 -4 -12 17 Profit/Loss of Discontinued Operations 18 Profit/Loss to Ordinary Shareholders 19 Net profit 20 Finance cost - Bank loans and overdrafts Finance cost - Bonds and other loans Dividends paid on preference shares Net gain/(loss) on derivatives for which hedge accounting is not applied Premium paid on buy back of preference shares Finance income Finance cost - Pensions and similar obligations Share of net profit/(loss) of joint ventures and associates Other income from non-current investments Profit before taxation 6,053 -382 157 -96 155 0 115 -94 127 21 22 18 8,153 104 7,469 23 -2,135 24 25 26 27 213 Taxation Tax on non-underlying items Non-controlling interests Net profit -2,322 655 -433 6,053 -363 5,184 28 AutoSave CF HD Assignment Recasting financial statements CASE STUDY-1 - Search duy thanh - File Home Insert Page Layout Formulas Data Review View Help Share Comments Arial 10 ~A A == 82 Wrap Text Custom . M X Insert Delete format AutoSum rill 48 O X Out [Copy Format Painter Clipboard Paste Ideas Sensitivity BIU Merge Center Clear Conditional Format as Cell Formatting Table Styles Styles Sort & Find & Filter Select Edbing Font Alignment Number Cels deas Sentity B3 -E24+25 B F H C D 2016 Unilever Balance Sheet in EUR million (IFRS) E 2017 2017 2016 4,087 3.439 3,962 2,271 10524 , 28, 101 76 3,213 1.0415 16,881 11,520 10,411 2,173 1,085 17,624 9,809 11,673 694 1,351 Non-current assets Goodwill Intangible assets Property, plant and equipment Pension asset for tunded schemes in surplus Deferred tax assets Financial assets Interest in not assets of joint ventures Interest in nct assets of associates Long-term trade and other receivables(a) Fair value of biological assets Operating lease prepayments for land Other non-financial assets 675 A 1 Standardized BALANCE SHEET - ASSETS 2 3 Cash and Cash Equivalents 4 Trade Receivables 5 Inventories 6 Other Current Assets / Non-Current Tangible Assets 8 Non-Current Intangible Assets 9 Minority Equity Investments 10 Other Non Operating investments 11 Deferred Tax Asset 12 Derivatives - Asset 13 Assets lleld for Sale 14 Total Assets 15 16 1/ 18 19 20 21 22 23 24 32 44 265 17 673 36 51 306 51 3,224 60,285 115 83 43,302 115 159 42,545 Current assets Inventories Trade receivables Prepayments and accrued income Other receivables Current tax assets Cash and cash equivalents Other financial assets 3,962 3,439 452 1,331 4BB 3,317 770 4,278 3,329 504 1,269 317 3,382 599 Other financial assets includes loans and receivables, available for sale financial assets, and financial assets at fair value through profit and loss. 206 13,884 25 Non-current assets held for sale 3,224 16,983 27 28 Income Slalement Balance Sheet + 100% Type here to search W A 4) ENG 11:06 PM 4/25/2021 B3 -C24+25 B C E H F 56,429 Total assets 60,285 7.968 Current liabilities Financial liabilities 7,968 5,150 Financial liabilities includes (primarily) bank loans and overdrafts, bonds and other loans A 29 30 Standardized BALANCE SHEET - EQUITY & LIABILITIES 31 Current Debt 32 33 Trade Payables 34 Other Current liabilities 35 Non-Current Debt 36 Deferred Tax Liability 37 Derivatives - Liability 38 Other Non Current Liabilities (non interest bearing) 39 Non-Controlling Interest in Equity 40 Preference Shares 11 Ordinary Shareholders' Equity 42 Liabilities Held For Sale 43 Total Liabilities and Shareholders' Equity 0.217 6,892 19,990 1.913 Trade payables Accrued expenses Social security and sundry takes Deferred consideration Other payables Current tax liabilities Provisions Liabilities associated with assets held for sale 8,217 3,666 539 26 978 1,088 525 170 23,177 3,655 468 151 1006 844 390 758 1 20,556 13,629 170 60.295 Non-current liabilities Financial liabilities 16,462 44 15 11,145 Financial liabilities includes (primarily) bank loans and overdrafts, bonds and other loans 120 118 Non-current tax liabilities Pensions and post-retirement healthcare liabilities 46 47 48 19 50 51 Funded schemes in deficit Unfunded schemes Provisions Deferred tax liabilities Other non curront liabilities 1,225 1,500 791 1,913 700 2,162 1,704 1,033 2,061 ( 667 19,893 52 22,721 51 55 Equity Called up share capital Share premium Other reserves Retained profit Non-controlling interests 57 58 59 60 61 484 130 -13,633 26,648 75B 14,387 484 134 -7,442 23,179 626 16,980 Total liabilities and equity 60,285 56,429 Income Statement Balance Sheet Type here to search w A4 ENG 11:06 PM 4/25/2021 G B 2017 2016 Unilever Income Statement in EUR million (IFRS) E 2017 2016 Notes 1 Standardized INCOME STATEMENT 2 3 Revenue 4 Cost of Sales (function) 5 SG&A (function) 6 Cost of Materials (nature) 7 Personnel Expenses (nature) Depreciation and Amortization (nature) 53,715 (27,306) (17,009) Turnover Cost of sales Distribution costs Gross profit 53,715 -27,306 -3,241 23,168 52,713 -26,983 -3,246 22,484 Non-underlying items -543 8 9 Other Operating Income, Net of Other Operating Expenses (functi 10 Other Operating Income, Net of Other Operating Expenses (natur 11 Interest Expense 12 Interest Income 13 Investment Income 14 Net Non-Recurring Income or Expense 15 Tax Expense 16 Profit/Loss to Non-Controlling Interest Brand and marketing investment Research and development (Other) selling and administrative expenses Operating profit -7,566 -900 -5,302 8,857 -823 Includes the after-tax effect of acquisition and disposal related costs, gains or losses on the disposal of group companies, restructuring costs, and impairments and other one-off items -7,731 -978 -5,151 7,801 (665) 157 173 (257) (2,322) (433) -67 -501 -46 -519 -4 13 -4 -12 17 Profit/Loss of Discontinued Operations 18 Profit/Loss to Ordinary Shareholders 19 Net profit 20 Finance cost - Bank loans and overdrafts Finance cost - Bonds and other loans Dividends paid on preference shares Net gain/(loss) on derivatives for which hedge accounting is not applied Premium paid on buy back of preference shares Finance income Finance cost - Pensions and similar obligations Share of net profit/(loss) of joint ventures and associates Other income from non-current investments Profit before taxation 6,053 -382 157 -96 155 0 115 -94 127 21 22 18 8,153 104 7,469 23 -2,135 24 25 26 27 213 Taxation Tax on non-underlying items Non-controlling interests Net profit -2,322 655 -433 6,053 -363 5,184 28 AutoSave CF HD Assignment Recasting financial statements CASE STUDY-1 - Search duy thanh - File Home Insert Page Layout Formulas Data Review View Help Share Comments Arial 10 ~A A == 82 Wrap Text Custom . M X Insert Delete format AutoSum rill 48 O X Out [Copy Format Painter Clipboard Paste Ideas Sensitivity BIU Merge Center Clear Conditional Format as Cell Formatting Table Styles Styles Sort & Find & Filter Select Edbing Font Alignment Number Cels deas Sentity B3 -E24+25 B F H C D 2016 Unilever Balance Sheet in EUR million (IFRS) E 2017 2017 2016 4,087 3.439 3,962 2,271 10524 , 28, 101 76 3,213 1.0415 16,881 11,520 10,411 2,173 1,085 17,624 9,809 11,673 694 1,351 Non-current assets Goodwill Intangible assets Property, plant and equipment Pension asset for tunded schemes in surplus Deferred tax assets Financial assets Interest in not assets of joint ventures Interest in nct assets of associates Long-term trade and other receivables(a) Fair value of biological assets Operating lease prepayments for land Other non-financial assets 675 A 1 Standardized BALANCE SHEET - ASSETS 2 3 Cash and Cash Equivalents 4 Trade Receivables 5 Inventories 6 Other Current Assets / Non-Current Tangible Assets 8 Non-Current Intangible Assets 9 Minority Equity Investments 10 Other Non Operating investments 11 Deferred Tax Asset 12 Derivatives - Asset 13 Assets lleld for Sale 14 Total Assets 15 16 1/ 18 19 20 21 22 23 24 32 44 265 17 673 36 51 306 51 3,224 60,285 115 83 43,302 115 159 42,545 Current assets Inventories Trade receivables Prepayments and accrued income Other receivables Current tax assets Cash and cash equivalents Other financial assets 3,962 3,439 452 1,331 4BB 3,317 770 4,278 3,329 504 1,269 317 3,382 599 Other financial assets includes loans and receivables, available for sale financial assets, and financial assets at fair value through profit and loss. 206 13,884 25 Non-current assets held for sale 3,224 16,983 27 28 Income Slalement Balance Sheet + 100% Type here to search W A 4) ENG 11:06 PM 4/25/2021 B3 -C24+25 B C E H F 56,429 Total assets 60,285 7.968 Current liabilities Financial liabilities 7,968 5,150 Financial liabilities includes (primarily) bank loans and overdrafts, bonds and other loans A 29 30 Standardized BALANCE SHEET - EQUITY & LIABILITIES 31 Current Debt 32 33 Trade Payables 34 Other Current liabilities 35 Non-Current Debt 36 Deferred Tax Liability 37 Derivatives - Liability 38 Other Non Current Liabilities (non interest bearing) 39 Non-Controlling Interest in Equity 40 Preference Shares 11 Ordinary Shareholders' Equity 42 Liabilities Held For Sale 43 Total Liabilities and Shareholders' Equity 0.217 6,892 19,990 1.913 Trade payables Accrued expenses Social security and sundry takes Deferred consideration Other payables Current tax liabilities Provisions Liabilities associated with assets held for sale 8,217 3,666 539 26 978 1,088 525 170 23,177 3,655 468 151 1006 844 390 758 1 20,556 13,629 170 60.295 Non-current liabilities Financial liabilities 16,462 44 15 11,145 Financial liabilities includes (primarily) bank loans and overdrafts, bonds and other loans 120 118 Non-current tax liabilities Pensions and post-retirement healthcare liabilities 46 47 48 19 50 51 Funded schemes in deficit Unfunded schemes Provisions Deferred tax liabilities Other non curront liabilities 1,225 1,500 791 1,913 700 2,162 1,704 1,033 2,061 ( 667 19,893 52 22,721 51 55 Equity Called up share capital Share premium Other reserves Retained profit Non-controlling interests 57 58 59 60 61 484 130 -13,633 26,648 75B 14,387 484 134 -7,442 23,179 626 16,980 Total liabilities and equity 60,285 56,429 Income Statement Balance Sheet Type here to search w A4 ENG 11:06 PM 4/25/2021


