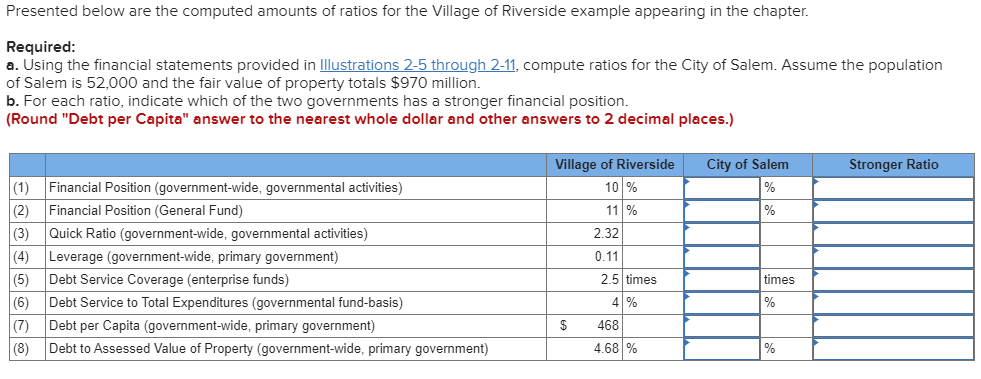
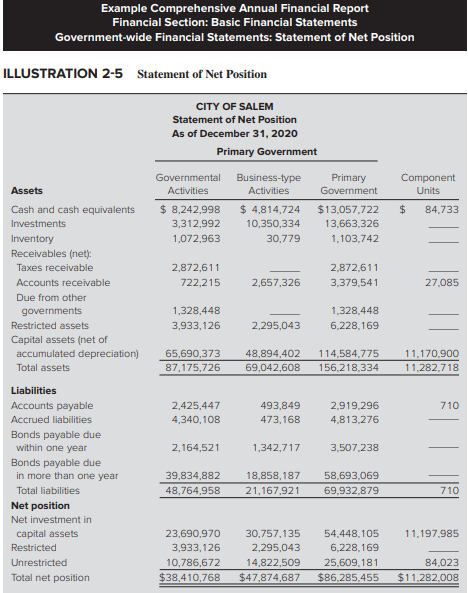
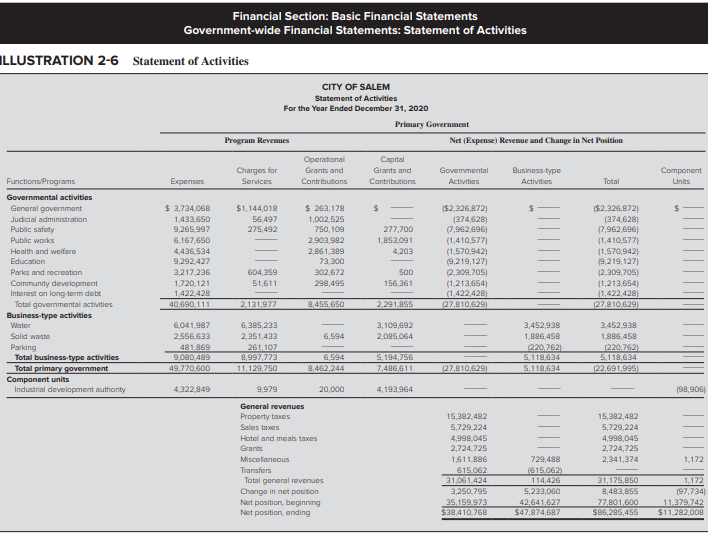
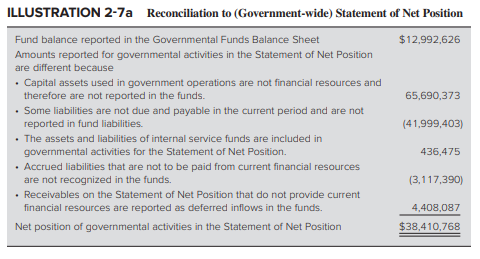
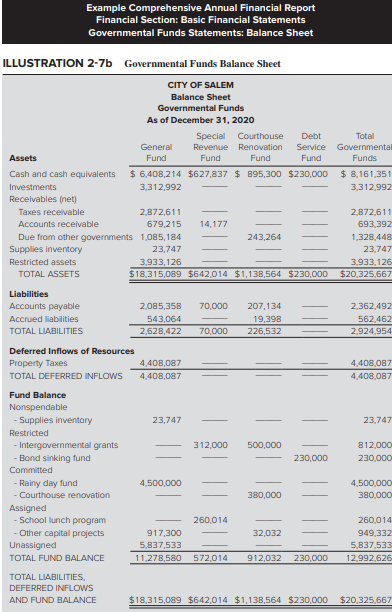
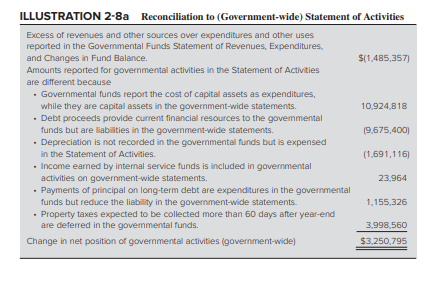
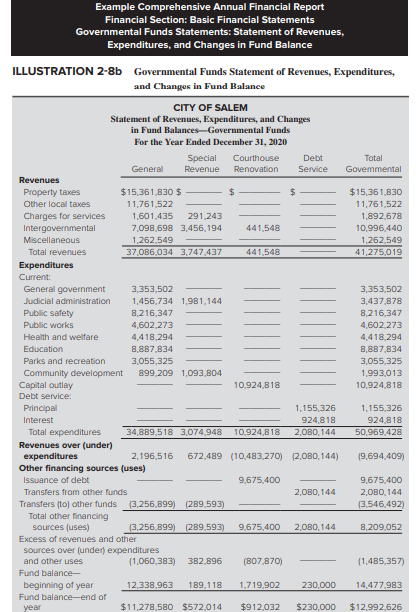
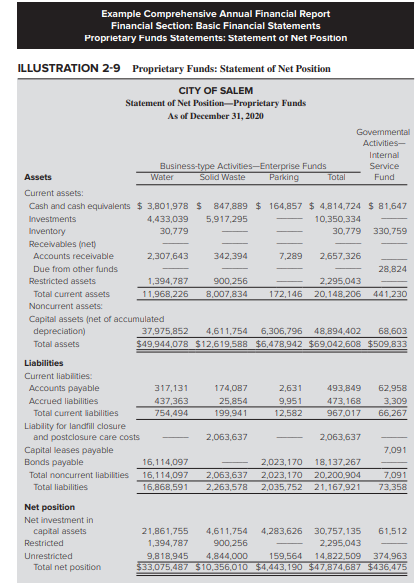
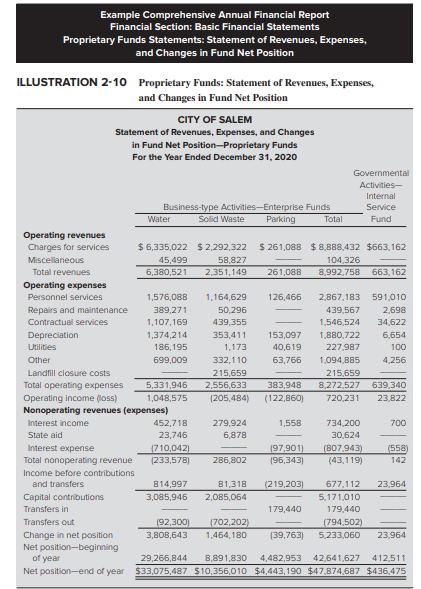
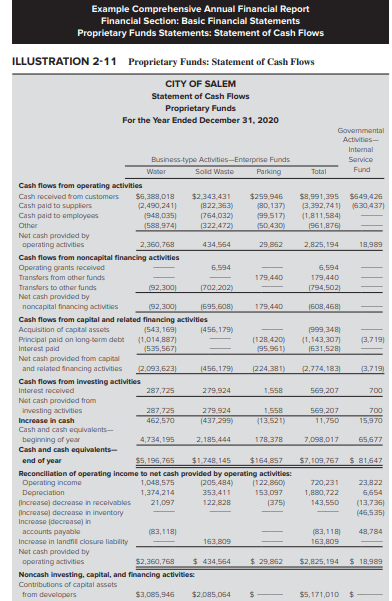
Presented below are the computed amounts of ratios for the Village of Riverside example appearing in the chapter. Required: a. Using the financial statements provided in Illustrations 2-5 through 2-11, compute ratios for the City of Salem. Assume the population of Salem is 52,000 and the fair value of property totals $970 million. b. For each ratio, indicate which of the two governments has a stronger financial position. (Round "Debt per Capita" answer to the nearest whole dollar and other answers to 2 decimal places.) City of Salem Stronger Ratio % (1) (2) (3) (4) (5) (6) (7) (8) Financial Position (government-wide, governmental activities) Financial Position (General Fund) Quick Ratio (government-wide, governmental activities) Leverage (government-wide, primary government) Debt Service Coverage (enterprise funds) Debt Service to Total Expenditures (governmental fund-basis) Debt per Capita (government-wide, primary government) Debt to Assessed Value of Property (government-wide, primary government) Village of Riverside 10 % 11 % 2.32 0.11 2.5 times times $ 468 4.68 % Example Comprehensive Annual Financial Report Financial Section: Basic Financial Statements Government-wide Financial Statements: Statement of Net Position ILLUSTRATION 2-5 Statement of Net Position CITY OF SALEM Statement of Net Position As of December 31, 2020 Primary Government Assets Governmental Activities $ 8,242,998 3,312,992 1,072,963 Business-type Activities $ 4,814,724 10.350.334 30,779 Primary Government $13,057,722 1 3,663,326 1,103,742 Component Units $ 84.733 Cash and cash equivalents Investments Inventory Receivables (net): Taxes receivable Accounts receivable Due from other governments Restricted assets Capital assets (net of accumulated depreciation) Total assets 2.872,611 722,215 2,657,326 2,872,611 3,379,541 27,085 1,328,448 3,933,126 1,328,448 6,228,169 2.295,043 65,690,373 87,175,726 48,894,402 69,042,608 114,584,775 156,218,334 11,170,900 11,282,718 2.425,447 4,340,108 493,849 473,168 2.919.296 4.813.276 2,164,521 1,342.717 3,507.238 Liabilities Accounts payable Accrued liabilities Bonds payable due within one year Bonds payable due in more than one year Total liabilities Net position Net investment in capital assets Restricted Unrestricted Total net position 39.834,882 48,764,958 18,858,187 21.167.921 58,693,069 69.932.879 710 11.197.985 23.690.970 3,933,126 10,786,672 $38,410,768 30.757,135 2,295,043 14,822.509 $47,874,687 54,448,105 6.228.169 25,609,181 $86,285,455 84,023 $11,282,008 Financial Section: Basic Financial Statements Government-wide Financial Statements: Statement of Activities ILLUSTRATION 2-6 Statement of Activities CITY OF SALEM Statement of Activities For the Year Ended December 31, 2020 Primary Government Program Revenues Net (Expense) Revenue and Change in Net Position Operational Grants and Contributions Charges for Services Capital Grants and Contributions Component Governmental Activities Business type Activities Functions Programs Expenses Total - $1,144,018 56,497 275,492 Governmental activities General government Judicial administration Public safety Public Works Health and welfare Education Parks and recreation Community development Interest on long-term debt Total governmental activities Business-type activities Water Solid waste 277,700 1,853,091 4203 $ 3,734,068 1,432 650 9,265 997 6,167,650 4,436.534 9.292427 3.217 236 1.720 121 1,422 428 40,690.111 $ 262,178 1.002.525 750, 109 2.902.982 2,861,399 73,300 302,672 298,495 $2,326,872) 374,628) (7.962,696) (1,410,577) (1.570.9421 19.219.1273 (2.309,705) (1.213.654) (1,422,428) 27,810,629) $2,326,872) 1374,629) 7,962,696) (1,410,5771 11.570,942) 19,219,127) 12.309,705) (1,213,654) 11,422,428) 127,810,629) 604,359 51,611 500 156,361 2 .131,977 8,455,650 2,291,855 3,109.692 2,085064 6,594 Parking 6041997 2 556 633 491.869 9,080,499 49,270 600 6.385 233 2,351,433 261,107 8,997,773 11,129,750 3,452938 1.896,458 220.762) 5,118,634 5,118,634 3.452 939 1.886 458 1220,762) 5.118.634 22,691,995) 6 - ,594 ,462,244 5,194,756 7,496,611 - 27,810,629 8 Total business-type activities Total primary government Component units Industrial development authority 4.322 949 9,979 20,000 4.193.964 199,906 General revenues Property taxes Sales taxes Hotel and meals taxes Grants Miscellaneous Transfers Total general revenues Change in net position Net position, beginning Net position ending 15,382 492 5.729 224 4.99R 045 2,724 225 1.611.886 615 062 31,061,424 3.250.795 35,159.973 $38,410,768 15,392.492 5,729 224 4,998.045 2,724,725 2,341,374 1.172 729,499 1615.062 114,426 5.232.060 42,641.627 $47,874,687 31,175.850 8,483,855 77.801.600 $86,285,455 1.172 197,734) 11.379.742 $11.292008 ILLUSTRATION 2-7a Reconciliation to (Government-wide) Statement of Net Position $12,992,626 65,690,373 (41.999,403) Fund balance reported in the Governmental Funds Balance Sheet Amounts reported for governmental activities in the Statement of Net Position are different because Capital assets used in government operations are not financial resources and therefore are not reported in the funds. . Some liabilities are not due and payable in the current period and are not reported in fund liabilities The assets and liabilities of internal service funds are included in governmental activities for the Statement of Net Position. Accrued liabilities that are not to be paid from current financial resources are not recognized in the funds. Receivables on the Statement of Net Position that do not provide current financial resources are reported as deferred inflows in the funds. Net position of governmental activities in the Statement of Net Position 436,475 (3,117,390) 4,408,087 $38,410,768 Example Comprehensive Annual Financial Report Financial Section: Basic Financial Statements Governmental Funds Statements: Balance Sheet ILLUSTRATION 2-7b Governmental Funds Balance Sheet CITY OF SALEM Balance Sheet Governmental Funds As of December 31, 2020 Special Courthouse Debt General Revenue Renovation Service Assets Fund Fund Fund Fund Cash and cash equivalents $ 6,408,214 $627.837 $ 895,300 $230,000 Investments 3.312.992 Receivables (net) Taxes receivable 2.872,611 Accounts receivable 679.215 14.177 Due from other governments 1,085,184 243,264 Supplies inventory 23,747 Restricted assets 3.933.126 TOTAL ASSETS $18,315,089 $642,014 $1,138,564 $230,000 Total Governmenta Funds $8,161,351 3,312,992 2,872,611 693,392 1,328,448 23,747 3.933,12 $20,325,667 70,000 - Liabilities Accounts payable Accrued liabilities TOTAL LIABILITIES 2,085,358 543,064 2.628,422 207,134 19,398 226,532 2,362,492 562.462 2.924,954 70,000 Deferred Inflows of Resources Property Taxes TOTAL DEFERRED INFLOWS 4,408,087 4,408,087 4,408,087 4,408,087 23,747 23.747 - 312.000 500.000 812,000 230,000 230,000 Fund Balance Nonspendable - Supplies inventory Restricted - Intergovernmental grants - Bond sinking fund Committed - Rainy day fund - Courthouse renovation Assigned - School lunch program - Other capital projects Unassigned TOTAL FUND BALANCE 4.500.000 4,500,000 380.000 380,000 260,014 - 32,032 - 917300 5.837533 11.278,580 260,014 949.332 5.837,533 12.992.626 572,014 912.032 230,000 TOTAL LIABILITIES DEFERRED INFLOWS AND FUND BALANCE $18,315,089 $642,014 $1,138,564 $230,000 $20.325,667 ILLUSTRATION 2-8a Reconciliation to (Government-wide) Statement of Activities $(1.485,357) 10,924,818 19,675,400) Excess of revenues and other sources over expenditures and other uses reported in the Governmental Funds Statement of Revenues, Expenditures, and Changes in Fund Balance, Amounts reported for governmental activities in the Statement of Activities are different because . Governmental funds report the cost of capital assets as expenditures, while they are capital assets in the government-wide statements Debl proceeds provide current financial resources to the govemmental funds but are abities in the government-wide statements. Depreciation is not recorded in the governmental funds but is expensed in the Statement of Activities. Income earned by internal service funds is included in governmental activities on government-wide statements. Payments of principal on long-term debt are expenditures in the governmental funds but reduce the liability in the government-wide statements Property taxes expected to be collected more than 60 days after year-end are deferred in the governmental funds. Change in net position of governmental activities (government-wide) (1,691,116) 23,964 1,155,326 3.998,560 $3,250,795 Example Comprehensive Annual Financial Report Financial Section: Basic Financial Statements Governmental Funds Statements: Statement of Revenues, Expenditures, and Changes in Fund Balance ILLUSTRATION 2-8b Governmental Funds Statement of Revenues, Expenditures, and Changes in Fund Balance Total Govermental $15,361,830 11,761,522 1,892,678 10,996,440 1,262,549 41,275,019 CITY OF SALEM Statement of Revenues, Expenditures, and Changes in Fund Balances-Governmental Funds For the Year Ended December 31, 2020 Special Courthouse Debt General Revenue Renovation Service Revenues Property taxes $15,361,830 $ - $ - Other local taxes 11,761,522 - Charges for services 1,601,435 291,243 Intergovernmental 7.098.698 3,456,194 441,548 Miscellaneous 1.262.549 - Total revenues 37,086,034 3.747,437 441,548 Expenditures Current General government 3,353,502 Judicial administration 1.456.734 1,981.144 Public Safety 8,216,347 Public Works 4,602 273 Health and welfare 4,418,294 Education 8,887,834 Parks and recreation recreation 3055 325 Community development 899,209 1093,804 Capital Outlay 10.924 818 Debt service Principal 1,155,326 Interest 924,818 Total expenditures 34,889,518 3,074.948 10,924,818 2.080,144 Revenues over (under) expenditures 2.196,516 672.489 (10,483.270) 2,080,144) Other financing sources (uses) Issuance of debt - 9,675.400 - Transfers from other funds 2,080,144 Transfers to other funds 3.256.899) 289,593) Total other financing sources (uses) 3.256.899) 289.593) 9.675.400 2.080,144 Excess of revenues and other sources over under expenditures and other uses (1.060,383) 382.896 (807.870) - Fund balance- beginning of year 12,338,963 189,118 1,719,902 230,000 Fund balance-end of year $11.278,580 $572,014 $912.032 $230.000 3,353,502 3,437,878 8,216,347 4,602,273 4,418,294 8,887,834 3,055,325 1.993,013 10.924 818 1.155,326 924,818 50.969,428 9.694.409) 9,675.400 2,080,144 3,546,492) 8.209,052 (1.485,357) 14.477.983 $12.992.626 Example Comprehensive Annual Financial Report Financial Section: Basic Financial Statements Proprietary Funds Statements: Statement of Net Position ILLUSTRATION 2-9 Proprietary Funds: Statement of Net Position CITY OF SALEM Statement of Net Position-Proprietary Funds As of December 31, 2020 Governmental Activities- Internal Business-type Activities Enterprise Funds Service Assets Water Solid Waste Parking Total Fund Current assets Cash and cash equivalents $ 3,801,978 $ 847,889 $ 164,857 $ 4,814,724 $ 81,647 Investments 4,433,0395,917,295 10,350,334 Inventory 30.779 30,779330,759 Receivables (net) Accounts receivable 2,307,643 342,394 7,289 2,657,326 Due from other funds - 28,824 Restricted assets 1,394,787 900,256 2.295,043 Total current assets 11,968,226 8,007,834 172,146 20.148.206 441,230 Noncurrent assets Capital assets (net of accumulated depreciation) 37,975,852 4,611,754 6,306,796 48,894,402 68,603 Total assets $49,944,078 $12.619,588 $6,478,942 $69.042.608 $509,833 174,087 25,854 199.941 2,631 9,951 12,582 493,84962,958 473,168 3.309 967017 66.267 Liabilities Current liabilities: Accounts payable 317,131 Accrued liabilities 437,363 Total current abilities 754,494 Liability for landfill closure and postclosure care costs Capital leases payable Bonds payable 16.114,097 Total noncurrent liabilities 16,114,097 Total liabilities 16,868,591 2.063.637 - 2,063,637 - 2.063,637 2.263,578 2023.170 2,023,170 2,035,752 18.137 267 20.200.904 21.167,921 7.091 - 7091 73.358 Net position Net investment in capital assets Restricted Unrestricted Total net position 21,861,755 4.611.754 4.283,626 30.757,135 61,512 1.394.787 900.256 - 2.295,043 9.818.945 4.844.000 159,564 14.822.509374.963 $33.075,487 $10.356.010 $4,443,190 347.874687 3436,475 Example Comprehensive Annual Financial Report Financial Section: Basic Financial Statements Proprietary Funds Statements: Statement of Revenues, Expenses, and Changes in Fund Net Position ILLUSTRATION 2-10 Proprietary Funds: Statement of Revenues, Expenses, and Changes in Fund Net Position CITY OF SALEM Statement of Revenues, Expenses, and Changes in Fund Net Position-Proprietary Funds For the Year Ended December 31, 2020 Government Activities Internal Business-type Activities-Enterprise Funds Service Water Solid Waste Parking Total Fund Operating revenues Charges for services $ 6,335,022 $ 2.292,322 $261,088 $8,888,432 $663,162 Miscellaneous 45,499 58,827 104,326 Total revenues 6,380,521 2,351,149 261,088 8,992,758 663.162 Operating expenses Personnel services 1,576,088 1,164,629 126,466 2,867,183 591,010 Repairs and maintenance 389,271 50,296 439,567 2,698 Contractual services 1,107,169 439,355 1,546,524 34,622 Depreciation 1,374,214 353.411 153,097 1.880,722 6,654 Utilities 186,195 1.173 40,619 227.987 100 Other 699,009 332.110 63,766 1,094,885 4,256 Landfill closure costs 215.659 215,659 Total operating expenses 5,331,9462,556,633 383,948 8.272,527 639,340 Operating income foss) 1,048,575 (205.484) (122,860) 720.231 23,822 Nonoperating revenues (expenses) Interest income 452,718 279.924 1.558 734 200 700 State aid 23,746 6,878 30.624 Interest expense 710.042) 197.901) (807943) (558) Total nonoperating revenue 233,578) 286,802 96,343) (43.119) 142 Income before contributions and transfers 814.997 81.318 219.203) 677,112 23,964 Capital contributions 3.085,946 2.085,064 5.171.010 Transfers in - 179,440 179,440 Transfers out 192,300 702,202) 794,502 Change in net position 3,808,643 1,464,180 39,763) 5.233,060 23,964 Net position-beginning of year 29,256,844 3.891.830 4,482,953 42,641,627 412,511 Net position-end of year $33,075,487 $10.356,010 $4,443,190 $47874,687 $436.475 Example Comprehensive Annual Financial Report Financial Section: Basic Financial Statements Proprietary Funds Statements: Statement of Cash Flows ILLUSTRATION 2-11 Proprietary Funds: Statement of Cash Flows CITY OF SALEM Statement of Cash Flows Proprietary Funds For the Year Ended December 31, 2020 Government Action Internal Service Fund Business-type Activities - Enterprise Funds Wat Solid Waste Parking Total Cash flows from operating activities Cash received from customers $6.388,018 $2 343 431 $259 966 991.295 6 49426 Cash paid to suppliers 2.490,241) 822 353) 80.137) 3,292,741) 30.437 Cash paid to employees 1948,035 754 032) 99517) 1.811.584) 588,974 3 22 472) 50.430) 1961 876 Not cash provided by operating activities 2.360,758 434 564 29 12 2,825194 1899 Cash flows from noncapital financing activities Operating grants received 5.594 5.594 Transfers from other funds 170.440 179,440 Transfers to other funds 92,300 702202) 794,502) No cash provided by noncapital facing activities 92,300 595 608) 179.440 508,468) Cash flows from capital and related financing activities Acquisition of cats assots 543, 1691 456.179) 999,348 Principal paid on long term debt 1,014,887) 128 420) 1,143.307) (2.7191 Interest paid (5.35,567) 95 961) 1631,528 Net cash provided from caps and related financing activities 2,093,623 456.179) 224 381) 2.774,183 3719 Cash flows from investing activities Interest received 287,725 279,924 1.558 569,207 700 Not cash provided from investing activities 287.725 279 924 558 569 207 700 462570 437299 13621) 11.750 15.970 Cash and cash ouivalents beginning of your 4.734,195 2.185.444 178.378 7098,017 65.577 Cash and cash equivalents and of your $5, 196,765 $1748 145 516457 $7109757 $81547 Reconciliation of operating income to net cash provided by operating activities Operating income 1.048 575 205 484 1122 720731 Depreciation 1 374214 353 411 1530971 722 654 Inca decres 21.097 122 828 375) (127 C o coase in inventory Cocoon accounts payable 2119 34 Increase in and closureliability 163 09 163 309 Not cash provided by operating activities $2.360,758 434 564 29 2 225194 19 Noncash investing, capital, and financing activities Contributions of capital assets from developers $3,085 946 $285 064 5.171.010 $ O Presented below are the computed amounts of ratios for the Village of Riverside example appearing in the chapter. Required: a. Using the financial statements provided in Illustrations 2-5 through 2-11, compute ratios for the City of Salem. Assume the population of Salem is 52,000 and the fair value of property totals $970 million. b. For each ratio, indicate which of the two governments has a stronger financial position. (Round "Debt per Capita" answer to the nearest whole dollar and other answers to 2 decimal places.) City of Salem Stronger Ratio % (1) (2) (3) (4) (5) (6) (7) (8) Financial Position (government-wide, governmental activities) Financial Position (General Fund) Quick Ratio (government-wide, governmental activities) Leverage (government-wide, primary government) Debt Service Coverage (enterprise funds) Debt Service to Total Expenditures (governmental fund-basis) Debt per Capita (government-wide, primary government) Debt to Assessed Value of Property (government-wide, primary government) Village of Riverside 10 % 11 % 2.32 0.11 2.5 times times $ 468 4.68 % Example Comprehensive Annual Financial Report Financial Section: Basic Financial Statements Government-wide Financial Statements: Statement of Net Position ILLUSTRATION 2-5 Statement of Net Position CITY OF SALEM Statement of Net Position As of December 31, 2020 Primary Government Assets Governmental Activities $ 8,242,998 3,312,992 1,072,963 Business-type Activities $ 4,814,724 10.350.334 30,779 Primary Government $13,057,722 1 3,663,326 1,103,742 Component Units $ 84.733 Cash and cash equivalents Investments Inventory Receivables (net): Taxes receivable Accounts receivable Due from other governments Restricted assets Capital assets (net of accumulated depreciation) Total assets 2.872,611 722,215 2,657,326 2,872,611 3,379,541 27,085 1,328,448 3,933,126 1,328,448 6,228,169 2.295,043 65,690,373 87,175,726 48,894,402 69,042,608 114,584,775 156,218,334 11,170,900 11,282,718 2.425,447 4,340,108 493,849 473,168 2.919.296 4.813.276 2,164,521 1,342.717 3,507.238 Liabilities Accounts payable Accrued liabilities Bonds payable due within one year Bonds payable due in more than one year Total liabilities Net position Net investment in capital assets Restricted Unrestricted Total net position 39.834,882 48,764,958 18,858,187 21.167.921 58,693,069 69.932.879 710 11.197.985 23.690.970 3,933,126 10,786,672 $38,410,768 30.757,135 2,295,043 14,822.509 $47,874,687 54,448,105 6.228.169 25,609,181 $86,285,455 84,023 $11,282,008 Financial Section: Basic Financial Statements Government-wide Financial Statements: Statement of Activities ILLUSTRATION 2-6 Statement of Activities CITY OF SALEM Statement of Activities For the Year Ended December 31, 2020 Primary Government Program Revenues Net (Expense) Revenue and Change in Net Position Operational Grants and Contributions Charges for Services Capital Grants and Contributions Component Governmental Activities Business type Activities Functions Programs Expenses Total - $1,144,018 56,497 275,492 Governmental activities General government Judicial administration Public safety Public Works Health and welfare Education Parks and recreation Community development Interest on long-term debt Total governmental activities Business-type activities Water Solid waste 277,700 1,853,091 4203 $ 3,734,068 1,432 650 9,265 997 6,167,650 4,436.534 9.292427 3.217 236 1.720 121 1,422 428 40,690.111 $ 262,178 1.002.525 750, 109 2.902.982 2,861,399 73,300 302,672 298,495 $2,326,872) 374,628) (7.962,696) (1,410,577) (1.570.9421 19.219.1273 (2.309,705) (1.213.654) (1,422,428) 27,810,629) $2,326,872) 1374,629) 7,962,696) (1,410,5771 11.570,942) 19,219,127) 12.309,705) (1,213,654) 11,422,428) 127,810,629) 604,359 51,611 500 156,361 2 .131,977 8,455,650 2,291,855 3,109.692 2,085064 6,594 Parking 6041997 2 556 633 491.869 9,080,499 49,270 600 6.385 233 2,351,433 261,107 8,997,773 11,129,750 3,452938 1.896,458 220.762) 5,118,634 5,118,634 3.452 939 1.886 458 1220,762) 5.118.634 22,691,995) 6 - ,594 ,462,244 5,194,756 7,496,611 - 27,810,629 8 Total business-type activities Total primary government Component units Industrial development authority 4.322 949 9,979 20,000 4.193.964 199,906 General revenues Property taxes Sales taxes Hotel and meals taxes Grants Miscellaneous Transfers Total general revenues Change in net position Net position, beginning Net position ending 15,382 492 5.729 224 4.99R 045 2,724 225 1.611.886 615 062 31,061,424 3.250.795 35,159.973 $38,410,768 15,392.492 5,729 224 4,998.045 2,724,725 2,341,374 1.172 729,499 1615.062 114,426 5.232.060 42,641.627 $47,874,687 31,175.850 8,483,855 77.801.600 $86,285,455 1.172 197,734) 11.379.742 $11.292008 ILLUSTRATION 2-7a Reconciliation to (Government-wide) Statement of Net Position $12,992,626 65,690,373 (41.999,403) Fund balance reported in the Governmental Funds Balance Sheet Amounts reported for governmental activities in the Statement of Net Position are different because Capital assets used in government operations are not financial resources and therefore are not reported in the funds. . Some liabilities are not due and payable in the current period and are not reported in fund liabilities The assets and liabilities of internal service funds are included in governmental activities for the Statement of Net Position. Accrued liabilities that are not to be paid from current financial resources are not recognized in the funds. Receivables on the Statement of Net Position that do not provide current financial resources are reported as deferred inflows in the funds. Net position of governmental activities in the Statement of Net Position 436,475 (3,117,390) 4,408,087 $38,410,768 Example Comprehensive Annual Financial Report Financial Section: Basic Financial Statements Governmental Funds Statements: Balance Sheet ILLUSTRATION 2-7b Governmental Funds Balance Sheet CITY OF SALEM Balance Sheet Governmental Funds As of December 31, 2020 Special Courthouse Debt General Revenue Renovation Service Assets Fund Fund Fund Fund Cash and cash equivalents $ 6,408,214 $627.837 $ 895,300 $230,000 Investments 3.312.992 Receivables (net) Taxes receivable 2.872,611 Accounts receivable 679.215 14.177 Due from other governments 1,085,184 243,264 Supplies inventory 23,747 Restricted assets 3.933.126 TOTAL ASSETS $18,315,089 $642,014 $1,138,564 $230,000 Total Governmenta Funds $8,161,351 3,312,992 2,872,611 693,392 1,328,448 23,747 3.933,12 $20,325,667 70,000 - Liabilities Accounts payable Accrued liabilities TOTAL LIABILITIES 2,085,358 543,064 2.628,422 207,134 19,398 226,532 2,362,492 562.462 2.924,954 70,000 Deferred Inflows of Resources Property Taxes TOTAL DEFERRED INFLOWS 4,408,087 4,408,087 4,408,087 4,408,087 23,747 23.747 - 312.000 500.000 812,000 230,000 230,000 Fund Balance Nonspendable - Supplies inventory Restricted - Intergovernmental grants - Bond sinking fund Committed - Rainy day fund - Courthouse renovation Assigned - School lunch program - Other capital projects Unassigned TOTAL FUND BALANCE 4.500.000 4,500,000 380.000 380,000 260,014 - 32,032 - 917300 5.837533 11.278,580 260,014 949.332 5.837,533 12.992.626 572,014 912.032 230,000 TOTAL LIABILITIES DEFERRED INFLOWS AND FUND BALANCE $18,315,089 $642,014 $1,138,564 $230,000 $20.325,667 ILLUSTRATION 2-8a Reconciliation to (Government-wide) Statement of Activities $(1.485,357) 10,924,818 19,675,400) Excess of revenues and other sources over expenditures and other uses reported in the Governmental Funds Statement of Revenues, Expenditures, and Changes in Fund Balance, Amounts reported for governmental activities in the Statement of Activities are different because . Governmental funds report the cost of capital assets as expenditures, while they are capital assets in the government-wide statements Debl proceeds provide current financial resources to the govemmental funds but are abities in the government-wide statements. Depreciation is not recorded in the governmental funds but is expensed in the Statement of Activities. Income earned by internal service funds is included in governmental activities on government-wide statements. Payments of principal on long-term debt are expenditures in the governmental funds but reduce the liability in the government-wide statements Property taxes expected to be collected more than 60 days after year-end are deferred in the governmental funds. Change in net position of governmental activities (government-wide) (1,691,116) 23,964 1,155,326 3.998,560 $3,250,795 Example Comprehensive Annual Financial Report Financial Section: Basic Financial Statements Governmental Funds Statements: Statement of Revenues, Expenditures, and Changes in Fund Balance ILLUSTRATION 2-8b Governmental Funds Statement of Revenues, Expenditures, and Changes in Fund Balance Total Govermental $15,361,830 11,761,522 1,892,678 10,996,440 1,262,549 41,275,019 CITY OF SALEM Statement of Revenues, Expenditures, and Changes in Fund Balances-Governmental Funds For the Year Ended December 31, 2020 Special Courthouse Debt General Revenue Renovation Service Revenues Property taxes $15,361,830 $ - $ - Other local taxes 11,761,522 - Charges for services 1,601,435 291,243 Intergovernmental 7.098.698 3,456,194 441,548 Miscellaneous 1.262.549 - Total revenues 37,086,034 3.747,437 441,548 Expenditures Current General government 3,353,502 Judicial administration 1.456.734 1,981.144 Public Safety 8,216,347 Public Works 4,602 273 Health and welfare 4,418,294 Education 8,887,834 Parks and recreation recreation 3055 325 Community development 899,209 1093,804 Capital Outlay 10.924 818 Debt service Principal 1,155,326 Interest 924,818 Total expenditures 34,889,518 3,074.948 10,924,818 2.080,144 Revenues over (under) expenditures 2.196,516 672.489 (10,483.270) 2,080,144) Other financing sources (uses) Issuance of debt - 9,675.400 - Transfers from other funds 2,080,144 Transfers to other funds 3.256.899) 289,593) Total other financing sources (uses) 3.256.899) 289.593) 9.675.400 2.080,144 Excess of revenues and other sources over under expenditures and other uses (1.060,383) 382.896 (807.870) - Fund balance- beginning of year 12,338,963 189,118 1,719,902 230,000 Fund balance-end of year $11.278,580 $572,014 $912.032 $230.000 3,353,502 3,437,878 8,216,347 4,602,273 4,418,294 8,887,834 3,055,325 1.993,013 10.924 818 1.155,326 924,818 50.969,428 9.694.409) 9,675.400 2,080,144 3,546,492) 8.209,052 (1.485,357) 14.477.983 $12.992.626 Example Comprehensive Annual Financial Report Financial Section: Basic Financial Statements Proprietary Funds Statements: Statement of Net Position ILLUSTRATION 2-9 Proprietary Funds: Statement of Net Position CITY OF SALEM Statement of Net Position-Proprietary Funds As of December 31, 2020 Governmental Activities- Internal Business-type Activities Enterprise Funds Service Assets Water Solid Waste Parking Total Fund Current assets Cash and cash equivalents $ 3,801,978 $ 847,889 $ 164,857 $ 4,814,724 $ 81,647 Investments 4,433,0395,917,295 10,350,334 Inventory 30.779 30,779330,759 Receivables (net) Accounts receivable 2,307,643 342,394 7,289 2,657,326 Due from other funds - 28,824 Restricted assets 1,394,787 900,256 2.295,043 Total current assets 11,968,226 8,007,834 172,146 20.148.206 441,230 Noncurrent assets Capital assets (net of accumulated depreciation) 37,975,852 4,611,754 6,306,796 48,894,402 68,603 Total assets $49,944,078 $12.619,588 $6,478,942 $69.042.608 $509,833 174,087 25,854 199.941 2,631 9,951 12,582 493,84962,958 473,168 3.309 967017 66.267 Liabilities Current liabilities: Accounts payable 317,131 Accrued liabilities 437,363 Total current abilities 754,494 Liability for landfill closure and postclosure care costs Capital leases payable Bonds payable 16.114,097 Total noncurrent liabilities 16,114,097 Total liabilities 16,868,591 2.063.637 - 2,063,637 - 2.063,637 2.263,578 2023.170 2,023,170 2,035,752 18.137 267 20.200.904 21.167,921 7.091 - 7091 73.358 Net position Net investment in capital assets Restricted Unrestricted Total net position 21,861,755 4.611.754 4.283,626 30.757,135 61,512 1.394.787 900.256 - 2.295,043 9.818.945 4.844.000 159,564 14.822.509374.963 $33.075,487 $10.356.010 $4,443,190 347.874687 3436,475 Example Comprehensive Annual Financial Report Financial Section: Basic Financial Statements Proprietary Funds Statements: Statement of Revenues, Expenses, and Changes in Fund Net Position ILLUSTRATION 2-10 Proprietary Funds: Statement of Revenues, Expenses, and Changes in Fund Net Position CITY OF SALEM Statement of Revenues, Expenses, and Changes in Fund Net Position-Proprietary Funds For the Year Ended December 31, 2020 Government Activities Internal Business-type Activities-Enterprise Funds Service Water Solid Waste Parking Total Fund Operating revenues Charges for services $ 6,335,022 $ 2.292,322 $261,088 $8,888,432 $663,162 Miscellaneous 45,499 58,827 104,326 Total revenues 6,380,521 2,351,149 261,088 8,992,758 663.162 Operating expenses Personnel services 1,576,088 1,164,629 126,466 2,867,183 591,010 Repairs and maintenance 389,271 50,296 439,567 2,698 Contractual services 1,107,169 439,355 1,546,524 34,622 Depreciation 1,374,214 353.411 153,097 1.880,722 6,654 Utilities 186,195 1.173 40,619 227.987 100 Other 699,009 332.110 63,766 1,094,885 4,256 Landfill closure costs 215.659 215,659 Total operating expenses 5,331,9462,556,633 383,948 8.272,527 639,340 Operating income foss) 1,048,575 (205.484) (122,860) 720.231 23,822 Nonoperating revenues (expenses) Interest income 452,718 279.924 1.558 734 200 700 State aid 23,746 6,878 30.624 Interest expense 710.042) 197.901) (807943) (558) Total nonoperating revenue 233,578) 286,802 96,343) (43.119) 142 Income before contributions and transfers 814.997 81.318 219.203) 677,112 23,964 Capital contributions 3.085,946 2.085,064 5.171.010 Transfers in - 179,440 179,440 Transfers out 192,300 702,202) 794,502 Change in net position 3,808,643 1,464,180 39,763) 5.233,060 23,964 Net position-beginning of year 29,256,844 3.891.830 4,482,953 42,641,627 412,511 Net position-end of year $33,075,487 $10.356,010 $4,443,190 $47874,687 $436.475 Example Comprehensive Annual Financial Report Financial Section: Basic Financial Statements Proprietary Funds Statements: Statement of Cash Flows ILLUSTRATION 2-11 Proprietary Funds: Statement of Cash Flows CITY OF SALEM Statement of Cash Flows Proprietary Funds For the Year Ended December 31, 2020 Government Action Internal Service Fund Business-type Activities - Enterprise Funds Wat Solid Waste Parking Total Cash flows from operating activities Cash received from customers $6.388,018 $2 343 431 $259 966 991.295 6 49426 Cash paid to suppliers 2.490,241) 822 353) 80.137) 3,292,741) 30.437 Cash paid to employees 1948,035 754 032) 99517) 1.811.584) 588,974 3 22 472) 50.430) 1961 876 Not cash provided by operating activities 2.360,758 434 564 29 12 2,825194 1899 Cash flows from noncapital financing activities Operating grants received 5.594 5.594 Transfers from other funds 170.440 179,440 Transfers to other funds 92,300 702202) 794,502) No cash provided by noncapital facing activities 92,300 595 608) 179.440 508,468) Cash flows from capital and related financing activities Acquisition of cats assots 543, 1691 456.179) 999,348 Principal paid on long term debt 1,014,887) 128 420) 1,143.307) (2.7191 Interest paid (5.35,567) 95 961) 1631,528 Net cash provided from caps and related financing activities 2,093,623 456.179) 224 381) 2.774,183 3719 Cash flows from investing activities Interest received 287,725 279,924 1.558 569,207 700 Not cash provided from investing activities 287.725 279 924 558 569 207 700 462570 437299 13621) 11.750 15.970 Cash and cash ouivalents beginning of your 4.734,195 2.185.444 178.378 7098,017 65.577 Cash and cash equivalents and of your $5, 196,765 $1748 145 516457 $7109757 $81547 Reconciliation of operating income to net cash provided by operating activities Operating income 1.048 575 205 484 1122 720731 Depreciation 1 374214 353 411 1530971 722 654 Inca decres 21.097 122 828 375) (127 C o coase in inventory Cocoon accounts payable 2119 34 Increase in and closureliability 163 09 163 309 Not cash provided by operating activities $2.360,758 434 564 29 2 225194 19 Noncash investing, capital, and financing activities Contributions of capital assets from developers $3,085 946 $285 064 5.171.010 $ O