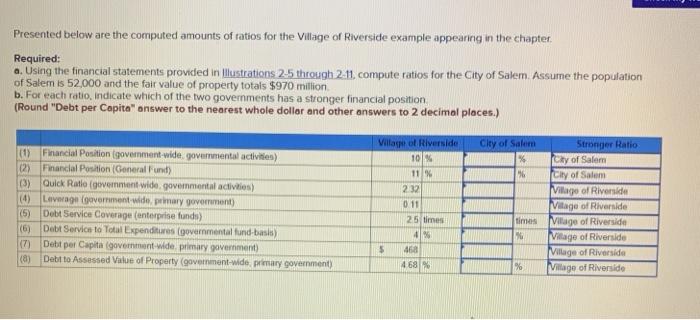
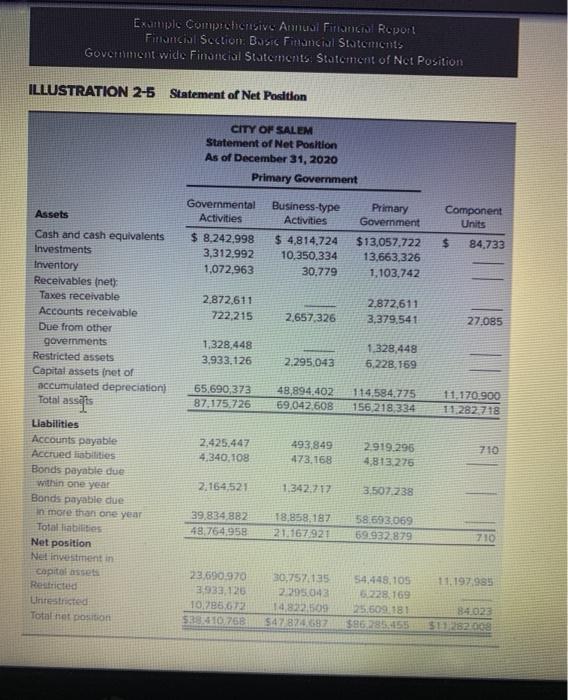
Presented below are the computed amounts of ratios for the Village of Riverside example appearing in the chapter. Required: a. Using the financial statements provided in Illustrations 2-5 through 2.11. compute ratios for the City of Salem Assume the population of Salem is 52,000 and the fair value of property totals $970 million b. For each ratio, indicate which of the two governments has a stronger financial position (Round "Debt per Capito" answer to the nearest whole dollar and other answers to 2 decimal places.) City of Salem % Village of Riverside 10% 11 232 011 (0) Financial Position (government-vide, governmental activities) (2) Financial Position (General Fund) (3) Quick Ratio (government wide governmental activities) (4) Leverage (government wide, primary government) (5) Debt Service Coverage (enterprise funds) (6) Debt Services to Total Expenditures (governmental fund-basis) (7) Debit per Capita (government-wide primary government (a) Debt to Assessed Value of Property (government-wide primary government 736 Stronger Ratio City of Salom City of Salem Village of Riverside Village of Riverside Milage of Riverside Village of Riverside Village of Riverside Village of Riverside times 25 times 4% 468 468 % $ % Example Comprehensive Annual Financial Report Financial Seclion Busic Financial Statements Govtalent wide Financial Statements Statement of Not Position ILLUSTRATION 2-5 Statement of Net Position CITY OF SALEM Statement of Net Position As of December 31, 2020 Primary Government Primary Government Component Units Governmental Activities $ 8.242.998 3,312,992 1,072,963 Business-type Activities $ 4,814.724 10.350.334 30.779 $ 84,733 $13,057,722 13,663,326 1,103,742 Assets Cash and cash equivalents Investments Inventory Receivables (net) Taxes receivable Accounts receivable Due from other governments Restricted assets Capital assets (net of accumulated depreciation Total assets 2.872,611 722.215 2,657 326 2.872,611 3,379,541 27.085 1.328,448 3,933,126 2.295,043 1.328,448 5.228.169 65,690,373 87.175.726 48,894,402 59,042,608 114,584.775 156 218,334 11.170.900 11.282718 2.425,447 4.340.108 493.849 173.168 2.919.296 4,813,275 710 2.164,521 1.342.217 3.507 238 Liabilities Accounts payable Accrued liabilities Bonds payable due within one year Bonds payable due in more than one year Total liabilities Net position Net investment in Capitolo Restricted Uitestricted Total het position 39.834 882 48.764,958 18,858.187 21.167921 58.693.069 59.932 879 1710 11.197.985 23.690.970 3933-126 10,785,672 539 410 768 30,757.135 2295043 14,82509 547 824.68 54,448,105 228.169 25,609 181 $86285.155 84.023 $112522000


