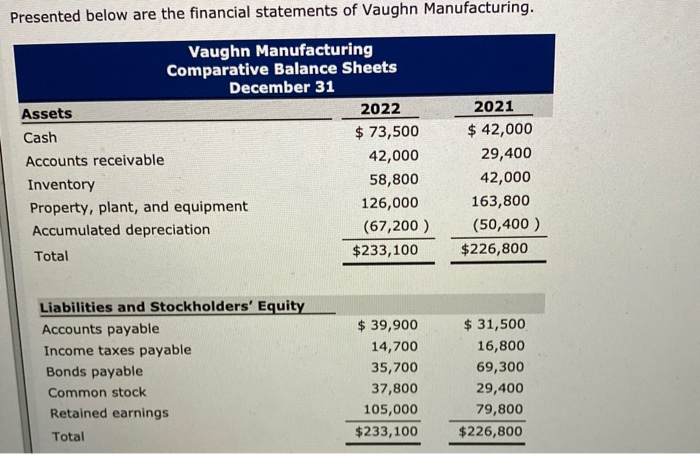
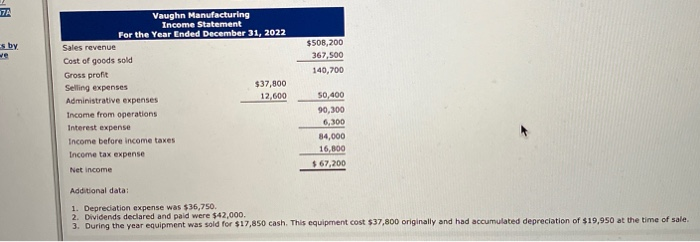
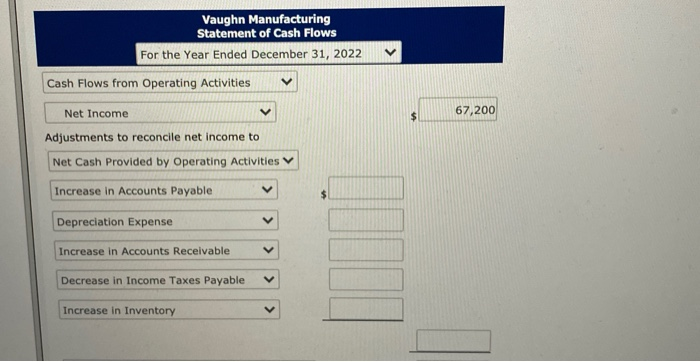
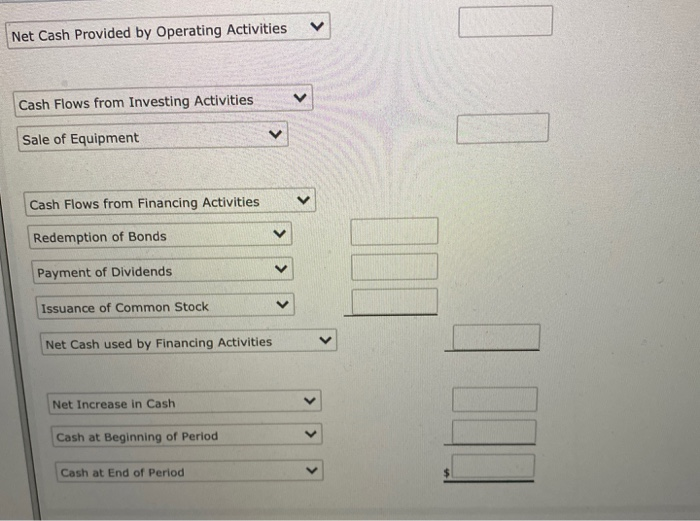
Presented below are the financial statements of Vaughn Manufacturing. Vaughn Manufacturing Comparative Balance Sheets December 31 Assets 2022 Cash $ 73,500 Accounts receivable 42,000 Inventory 58,800 Property, plant, and equipment 126,000 Accumulated depreciation (67,200 ) Total $233,100 2021 $ 42,000 29,400 42,000 163,800 (50,400 ) $226,800 Liabilities and Stockholders' Equity Accounts payable Income taxes payable Bonds payable Common stock Retained earnings Total $ 39,900 14,700 35,700 37,800 105,000 $233,100 $ 31,500 16,800 69,300 29,400 79,800 $226,800 7A s by $508,200 367,500 140,700 Vaughn Manufacturing Income Statement For the Year Ended December 31, 2022 Sales revenue Cost of goods sold Gross profit Selling expenses $37,800 Administrative expenses 12,600 Income from operations Interest expense Income before income taxes Income tax expense 50,400 90,300 6,300 84,000 16,800 $ 67,200 Net income Additional data: 1. Depreciation expense was $36,750. 2. Dividends declared and paid were $42,000. 3. During the year equipment was sold for $17,850 cash. This equipment cost $37,800 originally and had accumulated depreciation of $19,950 at the time of sale Vaughn Manufacturing Statement of Cash Flows For the Year Ended December 31, 2022 Cash Flows from Operating Activities Net Income 67,200 Adjustments to reconcile net income to Net Cash Provided by Operating Activities Increase in Accounts Payable $ Depreciation Expense Increase in Accounts Receivable Decrease in Income Taxes Payable Increase in Inventory V Net Cash Provided by Operating Activities ID Cash Flows from Investing Activities Sale of Equipment Cash Flows from Financing Activities Redemption of Bonds Payment of Dividends Issuance of Common Stock Net Cash used by Financing Activities Net Increase in Cash Cash at Beginning of Period Cash at End of Period Compute free cash flow. (Show a negative free cash flow with either a - sign e.g. -15,000 or in parenthesis e.g. (15,000).) Free cash flow