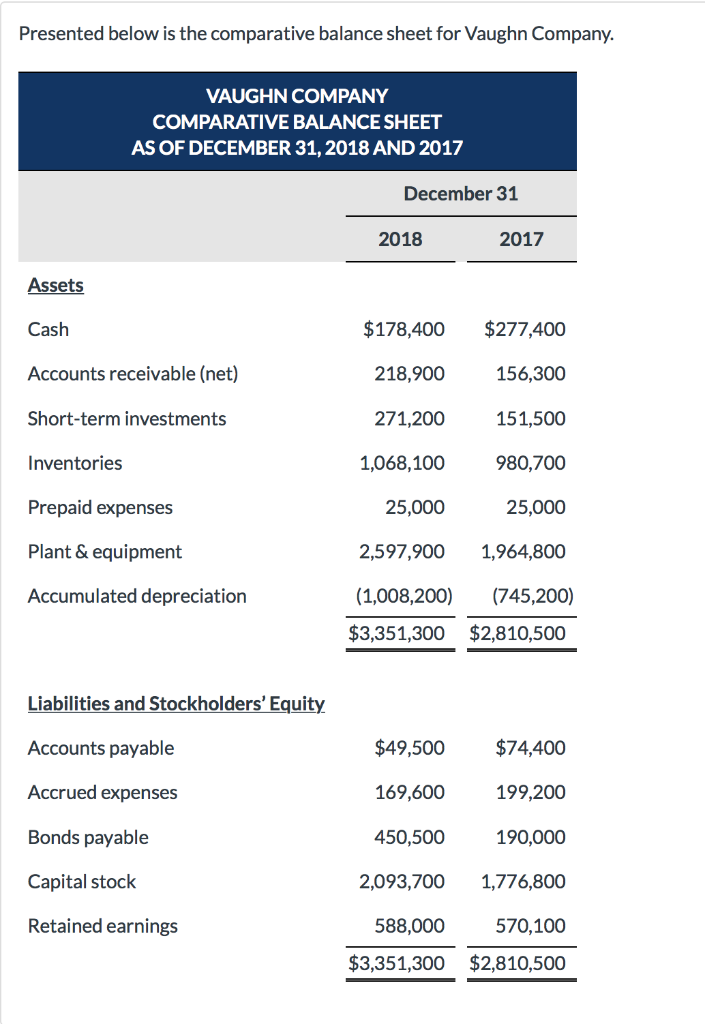
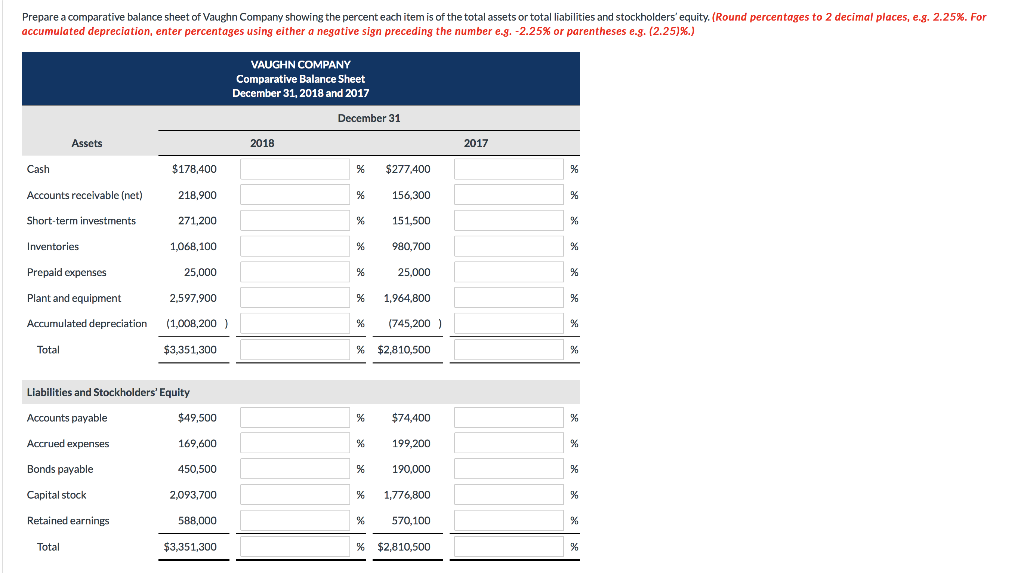
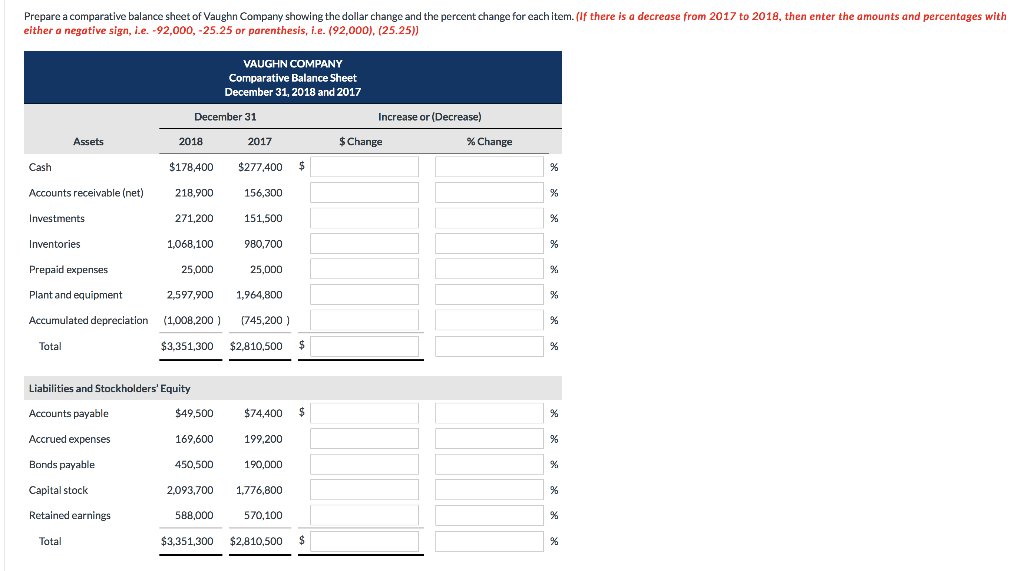
Presented below is the comparative balance sheet for Vaughn Company. VAUGHN COMPANY COMPARATIVE BALANCE SHEET AS OF DECEMBER 31, 2018 AND 2017 December 31 2018 2017 Assets Cash Accounts receivable (net) Short-term investments Inventories Prepaid expenses Plant & equipment Accumulated depreciation $178,400 $277,400 156,300 151,500 980,700 25,000 2,597,900 1,964,800 (1,008,200) (745,200) $3,351,300 $2,810,500 218,900 271,200 1,068,100 25,000 Liabilities and Stockholders' Equity Accounts payable Accrued expenses Bonds payable Capital stock Retained earnings $49,500 $74,400 199,200 190,000 2,093,700 1,776,800 570,100 $3,351,300 $2,810,500 169,600 450,500 588,000 Prepare a comparative balance sheet of Vaughn Company showing the percent each item is of the total assets or total liabilities and stockholders equity accumulated depreciation, enter percentages using either a negative sign preceding the number e.g.-2.25% or parentheses e-8, (2.25)%.) Round percentages to 2 decimal places, e . 2.25%. For VAUGHN COMPANY Comparative Balance Sheet December 31, 2018 and 2017 December 31 Assets 2018 2017 $178,400 218,900 271,200 1,068,100 25,000 2,597,900 % $277400 % 156,300 % 151,500 % 980,700 25,000 % 1,964.800 Accounts receivable (net) Short-term investments Inventories Prepaid expenses Plant and equipment Accumulated depreciation % (745,200) 1,008,200) $3,351,300 % $2,810,500 Total Liabilities and Stockholders' Equity Accounts payable Accrued expenses Bonds payable Capital stock Retained earnings $49,500 169,600 450,500 2,093,700 588,000 $3,351,300 % $74,400 % 199,200 190,000 % 1,776,800 % 570,100 % $2,810,500 Total Prepare a comparative balance sheet of Vaughn Company showing the dollar change and the percent change for eachitem. (lf there is a decrease from 2017 to 2018, then enter the amounts and percentages with either a negative sign, .e. -92,000, -25.25 or parenthesis, i.e. (92,000), (25.25) VAUGHN COMPANY Comparative Balance Sheet December 31, 2018 and 2017 Increase or (Decrease) December 31 $ Change % Change 2018 2017 $178,400 $277400 Cash Accounts receivable (net) Investments 218,900 271,200 1,068,100 25,000 151,500 80,700 25,000 2,597,900 1,964,800 Prepaid expenses Plant and equipment Accumulated depreciation (1,008,200 745,200) $3,351,300 $2,810,500 Total Liabilities and Stockholders' Equity Accounts payable Accrued expenses Bonds payable Capital stock Retained earnings $74,400 199,200 190,000 2,093,700 1,776,800 570,100 $3,351,300 $2,810,500 $49,500 169,600 450,500 588,000 Total