Answered step by step
Verified Expert Solution
Question
1 Approved Answer
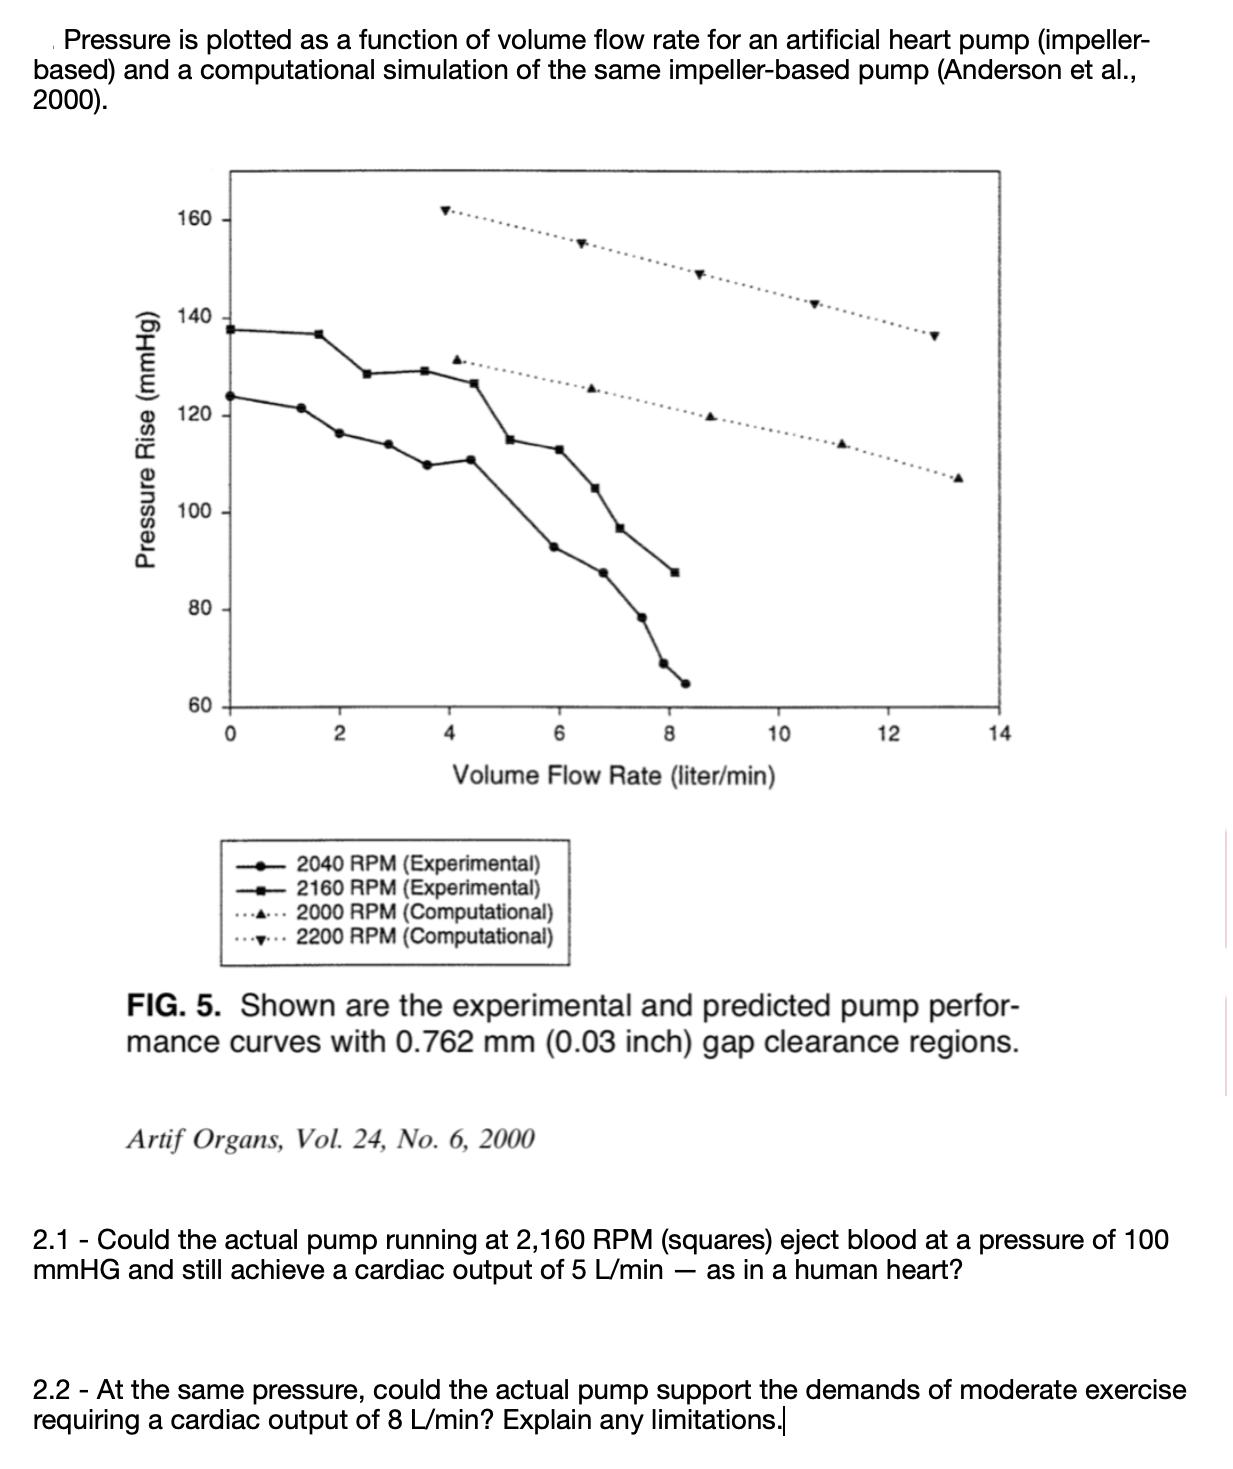
Pressure is plotted as a function of volume flow rate for an artificial heart pump (impeller- based) and a computational simulation of the same

Pressure is plotted as a function of volume flow rate for an artificial heart pump (impeller- based) and a computational simulation of the same impeller-based pump (Anderson et al., 2000). Pressure Rise (mmHg) 160 140 120 100 80 60 0 T 2 T 6 Volume Flow Rate (liter/min) 4 2040 RPM (Experimental) 2160 RPM (Experimental) 2000 RPM (Computational) 2200 RPM (Computational) 8 Artif Organs, Vol. 24, No. 6, 2000 10 12 14 FIG. 5. Shown are the experimental and predicted pump perfor- mance curves with 0.762 mm (0.03 inch) gap clearance regions. 2.1 - Could the actual pump running at 2,160 RPM (squares) eject blood at a pressure of 100 mmHG and still achieve a cardiac output of 5 L/min - as in a human heart? 2.2 - At the same pressure, could the actual pump support the demands of moderate exercise requiring a cardiac output of 8 L/min? Explain any limitations.
Step by Step Solution
There are 3 Steps involved in it
Step: 1
21 Yesthe actual pump running at 2160 RPM squares could eject blood at a pressure of 100 mmHg and still achieve a cardiac output of 5 Lmin as in a hum...
Get Instant Access to Expert-Tailored Solutions
See step-by-step solutions with expert insights and AI powered tools for academic success
Step: 2

Step: 3

Ace Your Homework with AI
Get the answers you need in no time with our AI-driven, step-by-step assistance
Get Started


