Pretty sure I have the majority right. someone double check and give me the answers anyway. please and thank you lads.
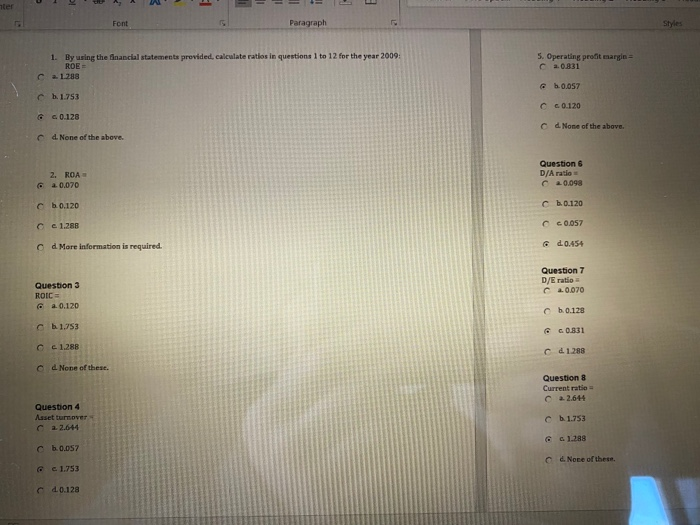
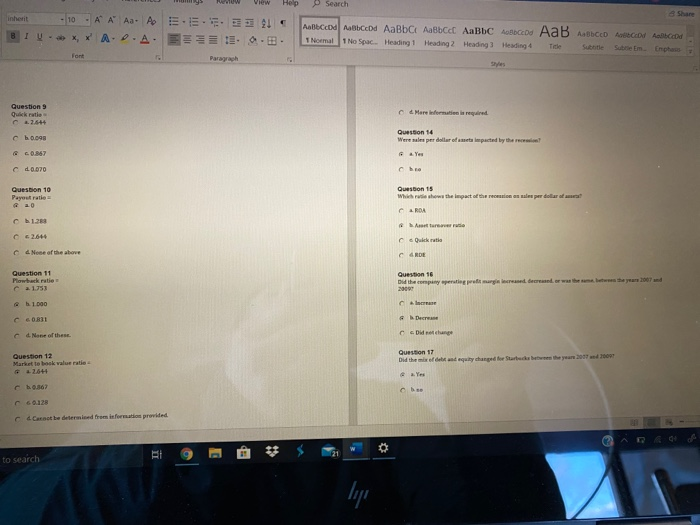
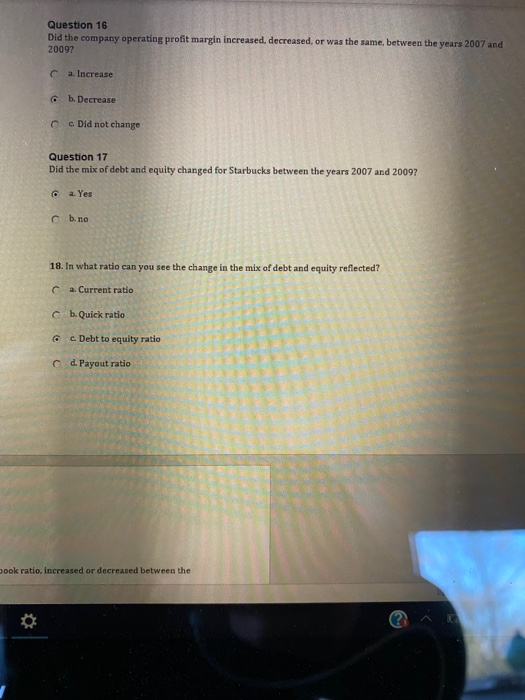
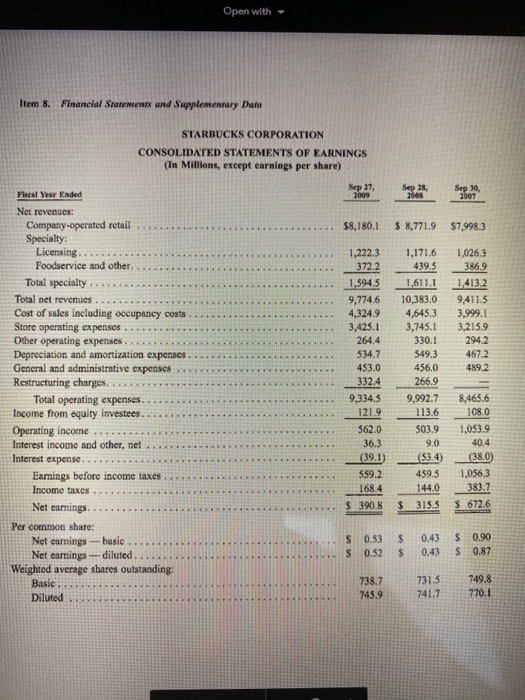
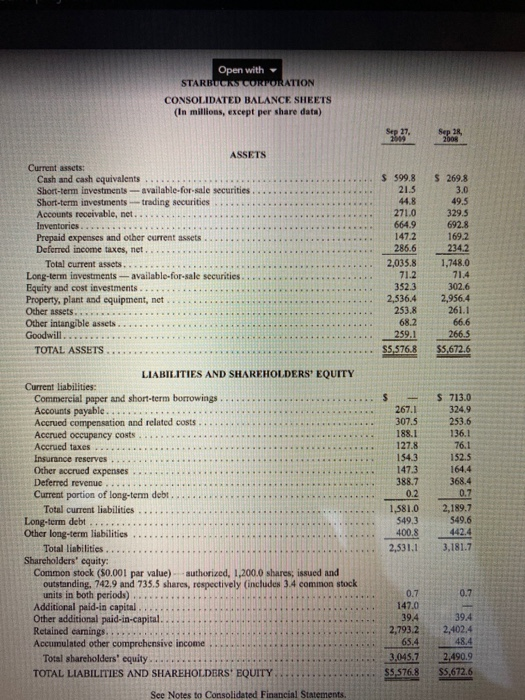
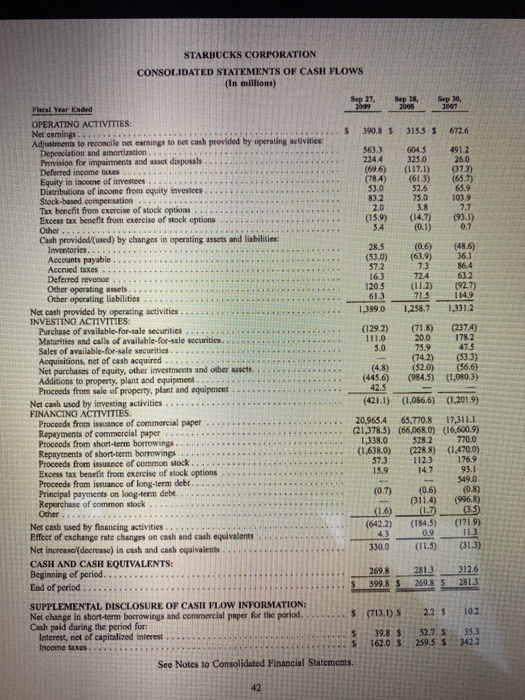
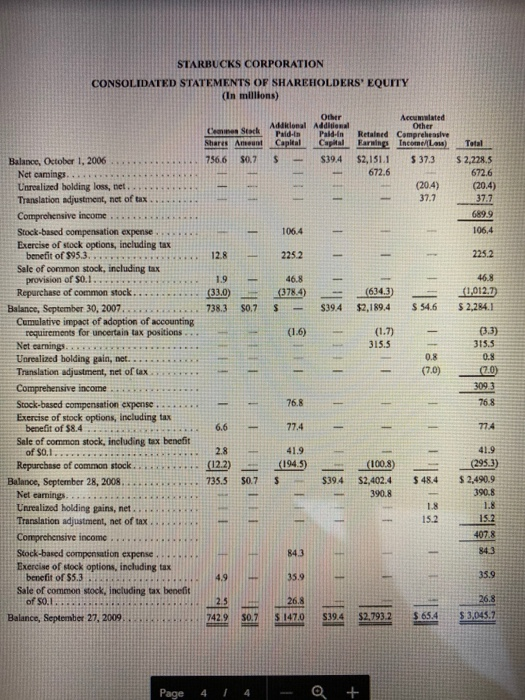
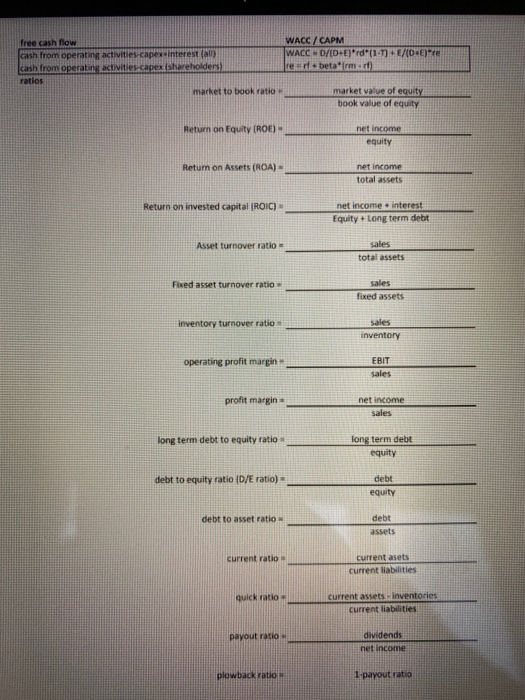
Paragraph 1. By using the financial statements provided, calculate ratios in questions 1 to 12 for the year 2009: ROE 1218 5. Operating profit margin= 0.831 c b.0.057 h. 1.753 0.120 c0.128 d. None of the above d. None of the above 2. ROA 40.070 Questions DIA ratio 20.098 cb 0.120 C 6.0.120 CC 1.288 -0.057 60.0.454 d. More information is required Question 3 Question 7 D/E ratio ca. 0.070 ROIC @ 4.0,120 6.0.128 1. 753 0.831 CC 1.288 2.1.288 None of these Questions Current ratio ca. 2.644 Question 4 Asset turnover c .2.644 b. 1.753 G41.288 b. 0.057 None of these 1.753 20.128 m ys UW View Help Search inherit BIU. E. - 10: A A A A X AD.A. . I . 21 18. 9.B ABD ABCD AaBb AaBbce AaBBC ABC AaB ABCED AGD d 1 Normal 1 No Spac. Heading 1 Heading 2 Heading Heading Title Sante S en. the Question 9 cd0070 Question 15 12 Nose of the above Question 16 Question 11 Plowback rate ca. 1.753 60831 Question 12 Market to book value ratio 264 60.128 C 4 Cacat be determined from information provided. to search Question 16 Did the company operating profit margin increased, decreased, or was the same, between the years 2007 and 20097 C a. Increase b. Decrease c. Did not change Question 17 Did the mix of debt and equity changed for Starbucks between the years 2007 and 2009? a. Yes cb.no 18. In what ratio can you see the change in the mix of debt and equity reflected? c a. Current ratio b. Quick ratio Debt to equity ratio do d. Payout ratio book ratio, increased or decreased between the Open with Item 8. Financial Statements and Supplementary Data STARBUCKS CORPORATION CONSOLIDATED STATEMENTS OF EARNINGS (in Millions, except earnings per share) $8.180.1 $ 8,771.9 $7,998.3 Fiscal Year Ended Net revenues: Company-operated retail.. Specialty: Licensing ... Foodservice and other.... Total specialty ........ Total net revenues .... Cost of sales including occupancy costs. Store operating expenses .. Other operating expenses....... Depreciation and amortization expenses General and administrative expenses Restructuring charges... Total operating expenses. - Income from equity investees. Operating income .... Interest income and other, net Interest expense. Eamings before income taxes Income taxes. Net earnings... Per common share: Net earnings-basic ....... Net earnings-diluted. Weighted average shares outstanding: Basic... Diluted ... 1,222.3 372. 2 1,594.5 9,774.6 4,324. 9 3,425.1 264.4 534.7 453.0 332.4 9,334.5 121.9 562.0 36.3 (39.1) 1.026.3 386.9 1.413.2 9,411.5 3,999.1 3,215.9 2942 467.2 489.2 1,171.6 439.5 1,611.1 10,383.0 4 ,645.3 3,745.1 330.1 549.3 456.0 266.9 9,992.7 113.6 503.9 90 (53.4) 459.5 144.0 $ 315.5 8,465.6 108.0 1,053.9 40.4 (38.0) 1,056,3 383.7 S 672.6 559.2 168.4 s 390 R S S 0.53 0.52 $ $ 0.43 0.43 $ S 0.90 0.87 738.7 745.9 731.5 741. 7 749.8 770.1 Open with STARBUCKS CORPORATION CONSOLIDATED BALANCE SHEETS (In millions, except per share data) S 269.8 3.0 49.5 ASSETS Current assets: Cash and cash equivalents .... Short-term investments - available for sale securities Short-term investments trading securities.. Accounts receivable, net.. Inventories.......... Prepaid expenses and other current assets Deferred income taxes, net...... Total current assets........ Long-term investments available-for-sale securities Equity and cost investments.. Property, plant and equipment, net. Other assets....... Other intangible assets.... Goodwill.... TOTAL ASSETS... $ 599.8 21.5 44.8 271.0 6649 147.2 286.6 2,035.8 352.3 2,536.4 253.8 68.2 259.1 $5,576.8 3295 692.8 169.2 234.2 1,748.0 71.4 302.6 2,956.4 261.1 66.6 266.5 $5,672.6 S 713.0 267.1 307.5 188.1 127.8 154.3 147.3 388.7 253.6 136.1 76.1 152.5 164.4 368.4 1.581.0 5493 LIABILITIES AND SHAREHOLDERS' EQUITY Current liabilities: Commercial paper and short-term borrowings Accounts payable..... Accrued compensation and related costs. Accrued occupancy costs Accrued taxes... Insurance reserves .... Other accrued expenses Deferred revenue Current portion of long-term debt.. Total current liabilities Long-term debt.. Other long-term liabilities Total liabilities. Shareholders' cquity: Common stock (50.001 par value) authorized, 1,200.0 shares, issued and outstanding, 742.9 and 735.5 shares, respectively includes 3.4 common stock units in both periods). Additional paid-in capital Other additional paid-in-capital. Retained earnings.... Accumulated other comprehensive income Total shareholders' equity TOTAL LIABILITIES AND SHAREHOLDERS' EQUITY See Notes to Consolidated Financial Statements. 2,189.7 549.6 442.4 2.531.1 0.7 147.0 39.4 2,793.2 394 2.402.4 3,045,7 2.490.9 SS $76.8 $5,672.6 STARBUCKS CORPORATION CONSOLIDATED STATEMENTS OF CASH FLOWS (in millions) 6726 491.2 26.0 373) (657) 65.9 103.9 7.7 (93.1) 0.7 (0.1) (486) 36.1 86.4 632 (92.7) 114.9 1.331.2 50 (237.4) 178.2 475 (533) (566) (1,080.3) Fiscal Year Ended OPERATING ACTIVITIES: Net earnings ..... 390.8 5 315.5 . Adjustments to reconcile net earnings to net cash provided by operating activities Depreciation and amortization 563.3 6045 Provision for impairments and asset disposals 224.4 3250 Deferred income taxes........ (696) (117.1) Equity in income of investees ... 161.3) Distributions of income from equity investees 75.0 Stock-based compensation Tax benefit from exercise of stock options .. .. Excess tax benefit from exercise of stock options (15,9) (14.71 Other ...... .. Cash provided (used) by changes in operating assets and liabilities Inventorics....... 285 (0.6) Accounts payable..... (53.0) (63.9) Accrued taxes ...... Deferred revenue... Other operating assets..... 120.5 Other operating liabilities ..... Net cash provided by operating activities 1389.0 INVESTTNG ACTIVITIES: Purchase of available for sale securities (129.2) (71.8) Maturities and calls of available for sale securities 111.0 20.0 Sales of available-for-sale securities ...... 75.9 Acquisitions, net of cash acquired ...... (74.2) Net purchases of equity, other investments and other assets (4.8) (520) Additions to property, plant and equipment ..... (445.6) (984.5) Proceeds from sale of property, plant and equipment 42.5 Net cash used by investing activities (421.1) (1,086.6) FINANCING ACTIVITIES Proceeds from issuance of commercial paper 20,965.4 65,770.8 Repayments of commercial paper .... (21.378.5) (66,068 0) Proceeds from short-term borrowings... 1,338.0 528.2 Repayments of sbort-term borrowings (1,638.0) (228.8) 573 1123 Proceeds from issuance of common Mock... 14.7 Excess tax benefit from exercise of stock options Proceeds from issuance of long-term debt. Principal payments on long-term debt. (0.7) (0.6) Repurchase of common stock (311.4) Other... (1.6) Net cash used by financing activities... (6422) Effect of exchange rate changes on cash and cash equivalent Net increase (decrease) in cash and cash equivalents 330.0 CASH AND CASH EQUIVALENTS: 269.8 Beginning of period...... End of period ..... 599.8 SUPPLEMENTAL DISCLOSURE OF CASII FLOW INFORMATION: Nel change in short-term borrowings and commercial paper for the period.... (713.1) S Cash paid during the period for: 39.8 $ 52.7 Interest, net of capitalized interest Income taxes. See Notes to Consolidated Financial Statements (1,201.9) 17,311.1 (16.600.9) 7700 15.9 (1.470.0) 176.9 93.1 549.0 (0.8) (996.8) S STARBUCKS CORPORATION CONSOLIDATED STATEMENTS OF SHAREHOLDERS' EQUITY In millions) Ceinen Stack Other Adilonal Additional Pald-in Pald-In Capital Capital $39.4 Acculated Other Retained Comprehensive Farning Income Las) $2,151.1 $ 37.3 672.6 Total $ 2.228.5 672.6 (20.4) 37.7 (20.4) 37.7 689.9 106.4 106,4 225.2 225.2 (378.4) (634.3) (33.0) 738.3 46,8 1,012.7) $ 2.284.1 $0.7 $394 $2.1894 (1.6) (1.7) 315.5 (3.3) 3155 08 (7.0) Balance, October 1, 2006 Net camings... Unrealized holding loss, bet Translation adjustment, net of tax Comprehensive income Stock-based compensation expense.. Exercise of stock options, including tax benefit of $95.3... Sale of common stock, including tax provision of $0.1....... Repurchase of common stock........ Balance, September 30, 2007 Cumulative impact of adoption of accounting requirements for uncertain tax positions Net carnings. ***** Unrealized holding gain, net... Translation adjustment, net of tax Comprehensive income Stock-based compensation expense... Exercise of stock options, including tax benefit of $8.4 .. Sale of common stock, including tax benefit of $0.1........... Repurchase of common stock.. Balance, September 28, 2008....... Net camnings. Unrealized holding gains, net. Translation adjustment, net of tax Comprehensive income Stock-based compensation expense.. Exercise of stock options, including tax benefit of $5.3 .. Sale of common stock, including tax benefit of so Balance, September 27, 2009.. 76.8 6.6 77.4 774 11 41.9 (1945) (122) 100.8) 41.9 (295.3) $2.490.9 390.8 7355 $39.4 $48.4 $2,402.4 390.8 soz s 1378 $ 147.0 3194 12,7982 $2,7932 $ 65,4 $ 3,045.7 Page 4 / 4 - Q + cash from operating activities capes interest an WACC/CAPM WACCD/CD+E)*rd(1-7)+E/(DE) re refbetarm rf) cash from operating activities market to book ratio market value of equity book value of equity Return on Equity (ROE) net income equity Return on Assets (ROA) net income total assets Return on invested capital [ROIC) _ net income interest Equity + Long term debt Asset turnover ratio- total assets Fixed asset turnover ratio cales fixed assets inventory turnover ratio Sales inventory operating profit margin EBIT sales profit margin- net income sales long term debt to equity ratio long term debt equity debt to equity ratio (D/E ratio) = debt equity debt to asset ratio debt current asets current liabilities current assets inventories current liabilities Payout ratio dividends 1-payout ratio
