

Answered step by step
Verified Expert Solution
Question
1 Approved Answer
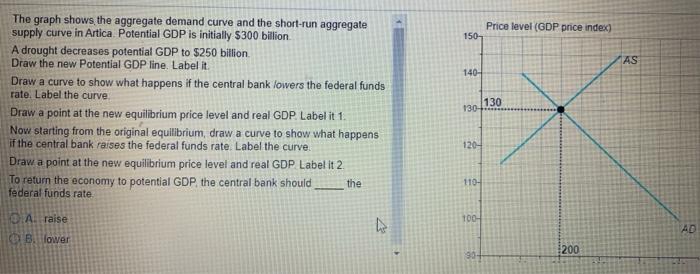
Price level (GDP price index 150 AS 140- The graph shows the aggregate demand curve and the short-run aggregate supply curve in Artica Potential GDP
Step by Step Solution
There are 3 Steps involved in it
Step: 1

Get Instant Access to Expert-Tailored Solutions
See step-by-step solutions with expert insights and AI powered tools for academic success
Step: 2

Step: 3
Ace Your Homework with AI
Get the answers you need in no time with our AI-driven, step-by-step assistance
Get Started
Essentials Of Applied Econometrics
Authors: Aaron D Smith, J Edward Taylor
1st Edition
0520288335, 9780520288331