Answered step by step
Verified Expert Solution
Link Copied!

Question

1 Approved Answer

Price level P c AD Output y Figure 9.1 Figure 9.1 shows three aggregate demand curves. A shift from curve AD to curve AD 2
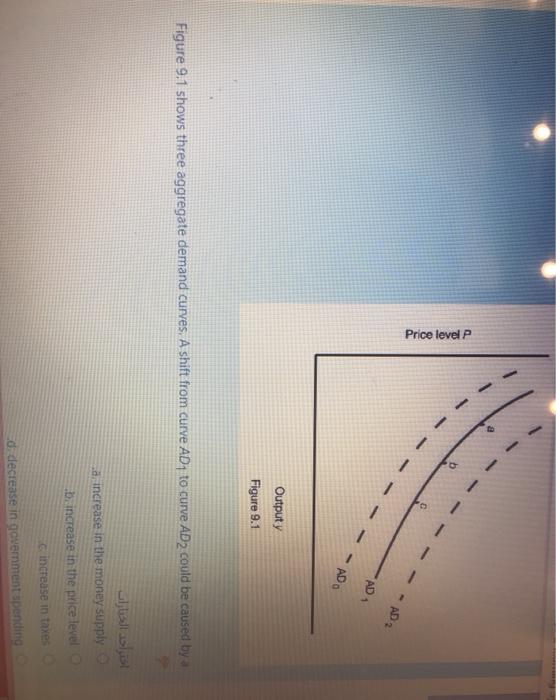
image text in transcribed
Price level P c AD Output y Figure 9.1 Figure 9.1 shows three aggregate demand curves. A shift from curve AD to curve AD 2 could be caused by a , increase in the money supply by increase in the price level increase in taxes Ed, decrease in government spending

Step by Step Solution

There are 3 Steps involved in it

Step: 1

blur-text-image

Get Instant Access to Expert-Tailored Solutions

See step-by-step solutions with expert insights and AI powered tools for academic success

Step: 2

blur-text-image

Step: 3

blur-text-image

Ace Your Homework with AI

Get the answers you need in no time with our AI-driven, step-by-step assistance

Get Started

Recommended Textbook for

Principles Of Econometrics

Authors: R Hill

4th Edition

1118136969, 9781118136966

More Books

Students also viewed these Economics questions

Question

What must a creditor do to become a secured party?

Answered: 1 week ago

Question

When should the last word in a title be capitalized?

Answered: 1 week ago

Question

Make efficient use of your practice time?

Answered: 1 week ago