

Answered step by step
Verified Expert Solution
Question
1 Approved Answer
Price Price, P FIGURE 9.6 Deriving Consumer Surplus from the Demand Curve Consumer surplus on each unit sold is the difference between the actual price
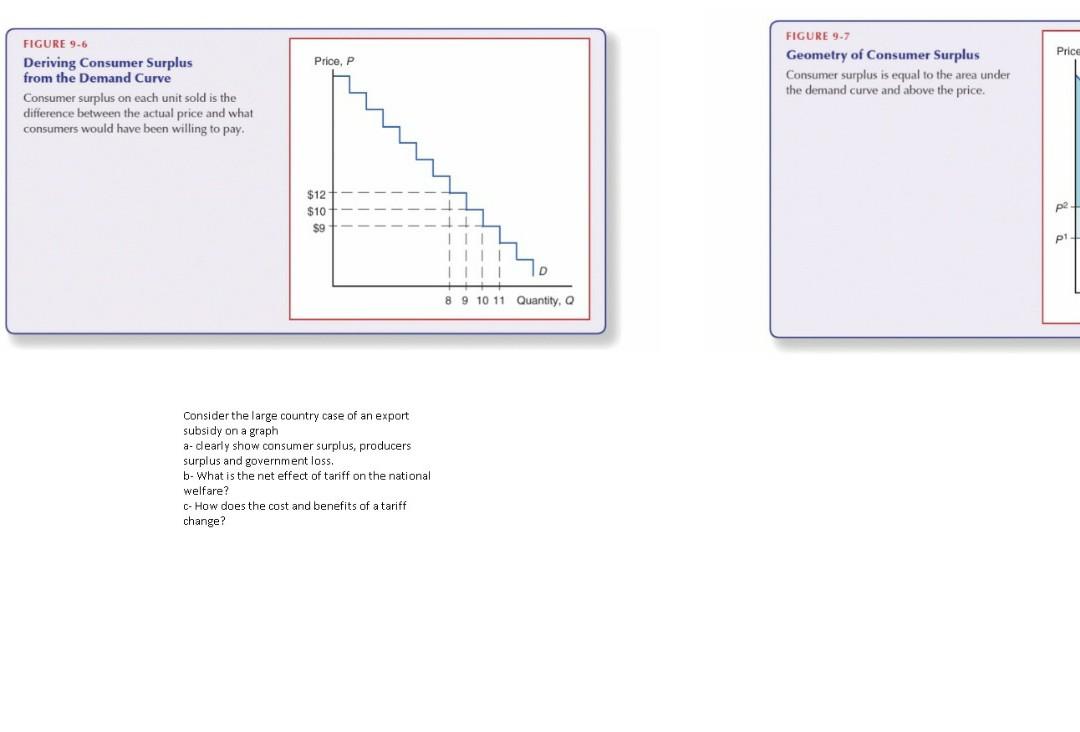
Price Price, P FIGURE 9.6 Deriving Consumer Surplus from the Demand Curve Consumer surplus on each unit sold is the difference between the actual price and what consumers would have been willing to pay FIGURE 9.7 Geometry of Consumer Surplus Consumer surplus is equal to the area under the demand curve and above the price. $12 $10 $9 P1 8 9 10 11 Quantity, O Consider the large country case of an export subsidy on a graph a-dearly show consumer surplus, producers surplus and government loss. b- What is the net effect of tariff on the national welfare? C- How does the cost and benefits of a tariff change
Step by Step Solution
There are 3 Steps involved in it
Step: 1

Get Instant Access to Expert-Tailored Solutions
See step-by-step solutions with expert insights and AI powered tools for academic success
Step: 2

Step: 3
Ace Your Homework with AI
Get the answers you need in no time with our AI-driven, step-by-step assistance
Get Started
Principles Of Econometrics
Authors: R Hill
4th Edition
1118136969, 9781118136966