Answered step by step
Verified Expert Solution
Question
1 Approved Answer
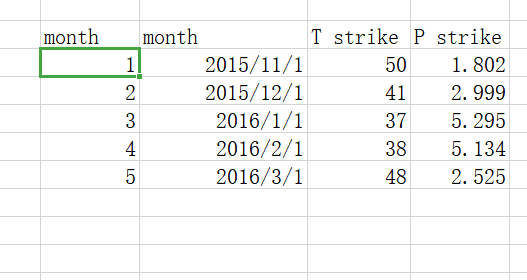
price structure with monthly payout Payout (month_i) = Notional *max (T strike - Tavg(month_i),0)*max(Pavg(month_i)-Pstrike,0) Pavg(month_i) = average spot during the month i (i=1..5) Tavg(month_i) =
price structure with monthly payout
Payout (month_i) = Notional *max (T strike - Tavg(month_i),0)*max(Pavg(month_i)-Pstrike,0)
Pavg(month_i) = average spot during the month "i" (i=1..5)
Tavg(month_i) = average Tavg during the month "i" (i=1..5)
pricing date :2015/9/30
Notional 50000 Mmmbtu/month


Please tell me the steps.
* Expected Loss (EL), or expected payout
* Shortfall (P99, 99th percentile of payout)
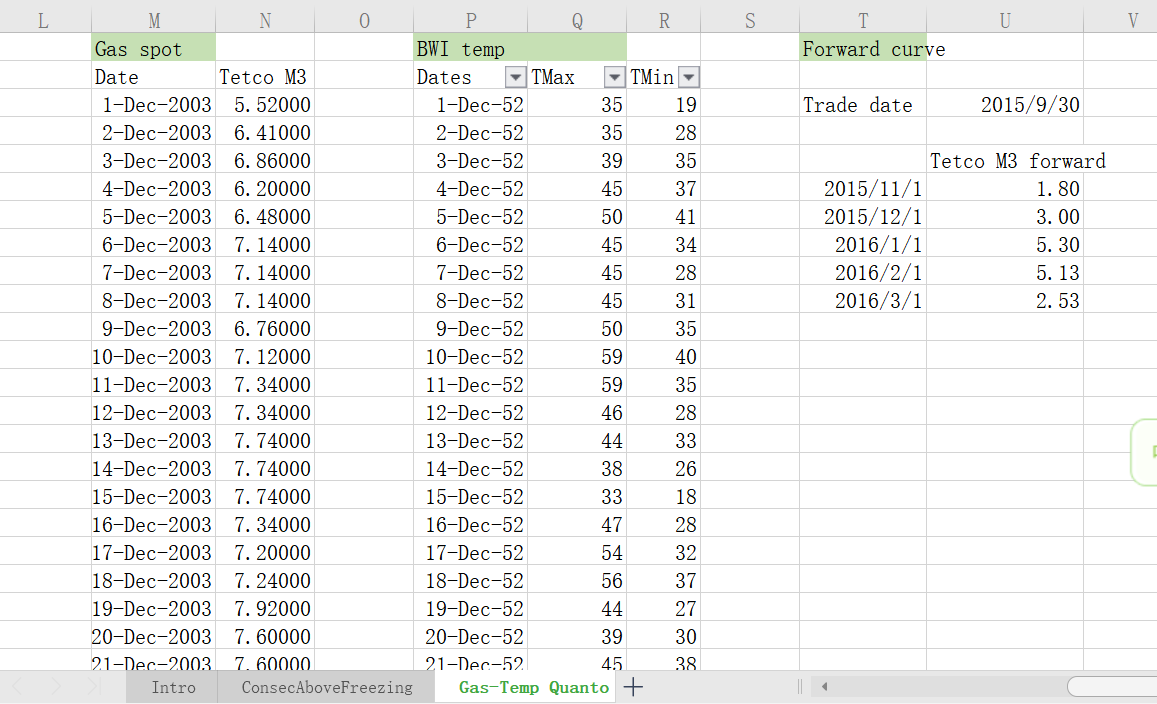
month 2 3 month T strike P strike 1 2015/11/1 50 1. 802 2 2015/12/1 41 2. 999 3 2016/1/1 37 5. 295 4 2016/2/1 38 5. 134 5 2016/3/1 48 2.525 L S U V T Forward curve BWI temp Trade date 2015/9/30 Tetco M3 forward 2015/11/1 1.80 2015/12/1 3.00 2016/1/1 5. 30 2016/2/1 5. 13 2016/3/1 2. 53 M N 0 P Q R Gas spot Date Tetco M3 Dates TMax TMin - 1-Dec-2003 5. 52000 1-Dec-52 35 19 2-Dec-2003 6. 41000 2-Dec-52 35 28 3-Dec-2003 6. 86000 3-Dec-52 39 35 4-Dec-2003 6. 20000 4-Dec-52 45 37 5-Dec-2003 6. 48000 5-Dec-52 50 41 6-Dec-2003 7. 14000 6-Dec-52 45 34 7-Dec-2003 7. 14000 7-Dec-52 45 28 8-Dec-2003 7. 14000 8-Dec-52 45 31 9-Dec-2003 6. 76000 9-Dec-52 50 35 10-Dec-2003 7. 12000 10-Dec-52 59 40 11-Dec-2003 7. 34000 11-Dec-52 59 35 12-Dec-2003 7. 34000 12-Dec-52 46 28 13-Dec-2003 7. 74000 13-Dec-52 44 33 14-Dec-2003 7. 74000 14-Dec-52 38 26 15-Dec-2003 7. 74000 15-Dec-52 33 18 16-Dec-2003 7.34000 16-Dec-52 47 28 17-Dec-2003 7. 20000 17-Dec-52 54 32 18-Dec-2003 7. 24000 18-Dec-52 56 37 19-Dec-2003 7.92000 19-Dec-52 44 27 20-Dec-2003 7. 60000 20-Dec-52 39 30 21-Dec-2003 7. 60000 21-Dec-52 45 38 Intro ConsecAboveFreezing Gas-Temp Quanto + month 2 3 month T strike P strike 1 2015/11/1 50 1. 802 2 2015/12/1 41 2. 999 3 2016/1/1 37 5. 295 4 2016/2/1 38 5. 134 5 2016/3/1 48 2.525 L S U V T Forward curve BWI temp Trade date 2015/9/30 Tetco M3 forward 2015/11/1 1.80 2015/12/1 3.00 2016/1/1 5. 30 2016/2/1 5. 13 2016/3/1 2. 53 M N 0 P Q R Gas spot Date Tetco M3 Dates TMax TMin - 1-Dec-2003 5. 52000 1-Dec-52 35 19 2-Dec-2003 6. 41000 2-Dec-52 35 28 3-Dec-2003 6. 86000 3-Dec-52 39 35 4-Dec-2003 6. 20000 4-Dec-52 45 37 5-Dec-2003 6. 48000 5-Dec-52 50 41 6-Dec-2003 7. 14000 6-Dec-52 45 34 7-Dec-2003 7. 14000 7-Dec-52 45 28 8-Dec-2003 7. 14000 8-Dec-52 45 31 9-Dec-2003 6. 76000 9-Dec-52 50 35 10-Dec-2003 7. 12000 10-Dec-52 59 40 11-Dec-2003 7. 34000 11-Dec-52 59 35 12-Dec-2003 7. 34000 12-Dec-52 46 28 13-Dec-2003 7. 74000 13-Dec-52 44 33 14-Dec-2003 7. 74000 14-Dec-52 38 26 15-Dec-2003 7. 74000 15-Dec-52 33 18 16-Dec-2003 7.34000 16-Dec-52 47 28 17-Dec-2003 7. 20000 17-Dec-52 54 32 18-Dec-2003 7. 24000 18-Dec-52 56 37 19-Dec-2003 7.92000 19-Dec-52 44 27 20-Dec-2003 7. 60000 20-Dec-52 39 30 21-Dec-2003 7. 60000 21-Dec-52 45 38 Intro ConsecAboveFreezing Gas-Temp Quanto +Step by Step Solution
There are 3 Steps involved in it
Step: 1

Get Instant Access to Expert-Tailored Solutions
See step-by-step solutions with expert insights and AI powered tools for academic success
Step: 2

Step: 3

Ace Your Homework with AI
Get the answers you need in no time with our AI-driven, step-by-step assistance
Get Started


