Answered step by step
Verified Expert Solution
Question
1 Approved Answer
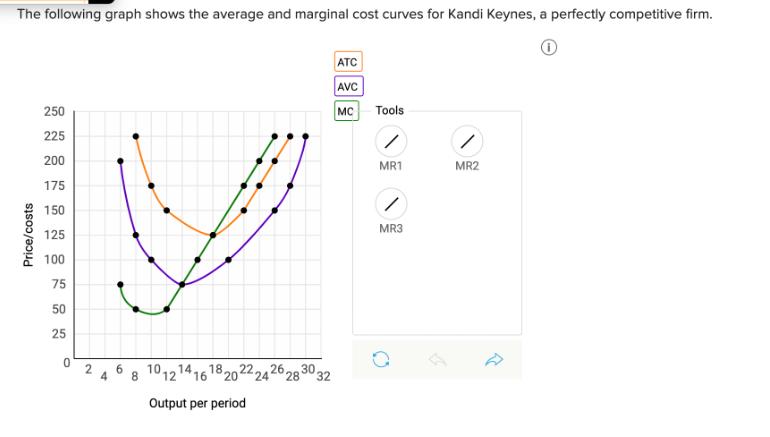
Price/costs The following graph shows the average and marginal cost curves for Kandi Keynes, a perfectly competitive firm. 250 225 200 175 150 125


Price/costs The following graph shows the average and marginal cost curves for Kandi Keynes, a perfectly competitive firm. 250 225 200 175 150 125 100 75 50 25 0 6 8 101214 12 14 16 18, 201 24' Output per period 22. 2028 30 32 ATC AVC MC Tools / MR1 MR2 MR3 a. If the price is $175, draw in the marginal revenue curve, and label it MR1. Plot only the end points on the graph above. b. At this price, what are the break-even output(s), the profit-maximizing output, and the level of total profits at that output? Break-even output(s): [ profit-maximizing output: [ and for a total profit of $[ c. Draw a marginal revenue curve, labelled MR2, which ensures that, at best, the firm breaks even. Plot only the end points on the graph above. d. What is the corresponding value of the price (marginal revenue)? Price: $ e. Draw a marginal revenue curve, labelled MR3, which ensures that, at best, the firm just remains in operation. Plot only the end points on the graph above. f. What is the corresponding shutdown price? T Shutdown price: $|
Step by Step Solution
There are 3 Steps involved in it
Step: 1

Get Instant Access to Expert-Tailored Solutions
See step-by-step solutions with expert insights and AI powered tools for academic success
Step: 2

Step: 3

Ace Your Homework with AI
Get the answers you need in no time with our AI-driven, step-by-step assistance
Get Started


